Last updated: August 24, 2026.
Quick Answer
Arctic sea ice is not just shrinking in area — it is getting young. Ice more than four years old has collapsed by 95% since the 1985–2004 baseline, from 1.72 million square kilometres down to just 95,000 at the September 2025 minimum. On 2 August 2026 Arctic extent stood at 7.02 million km2, the 9th lowest for the date in a 47-year satellite record and 1.38 million km2 below the 1981–2010 average. The Arctic has now had two record-equalling low winter maxima in a row, and 2025 was its warmest year since 1900. Meanwhile the oceans absorbing that heat set records of their own: global sea level hit a record high for the 14th consecutive year, and ocean heat content down to 2,000 metres reached its highest level ever measured.
Where Arctic Sea Ice Stands Right Now
The Met Office publishes a monthly sea ice briefing, and the August 2026 edition — compiled by Alex West and Ed Blockley — puts the current melt season in context.
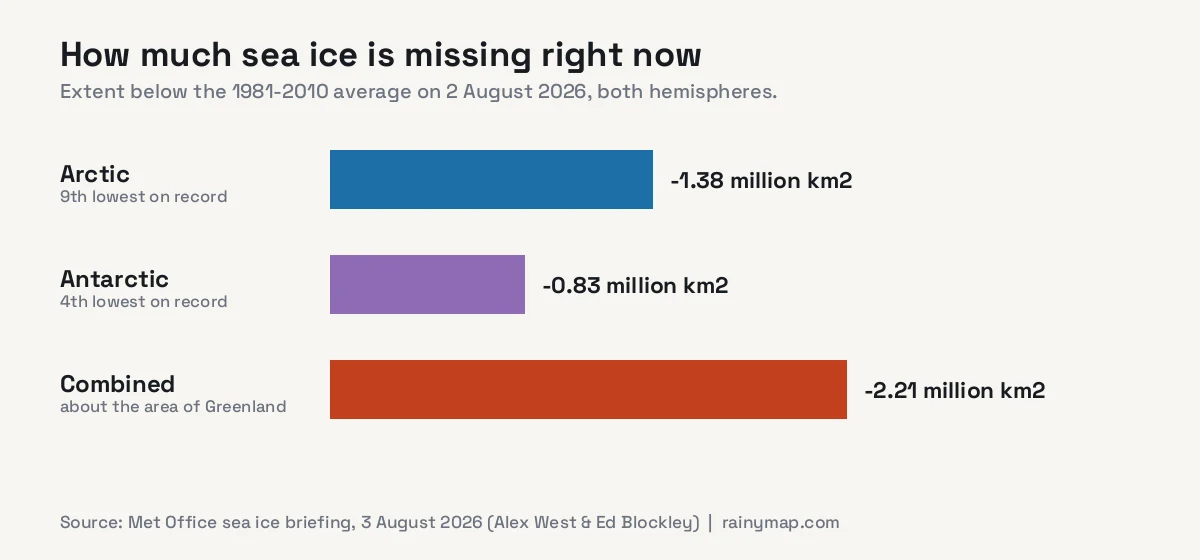
- 2 August 2026 extent: 7.02 million km2 — 9th lowest on record for the date, and 1.38 million km2 below the 1981–2010 average.
- July 2026 monthly average: 8.29 million km2 — joint 5th lowest July on record, 1.55 million km2 below average.
- Melt rate through July: 86,000 km2 per day, against an average of 80,000 km2 per day.
- Record low for the date: 6.30 million km2, set in 2020.
The losses are not evenly spread. The Kara Sea is exceptionally low, and the Atlantic-facing seas — Greenland Sea, Fram Strait, Barents, Laptev and East Siberian — are all well below average. The Beaufort and Chukchi Seas, on the Pacific side, are running close to normal. That geographic split matters, because the Atlantic side is where warm water intrudes into the Arctic Basin.
It is worth being precise about what “9th lowest” means. This is not a record-breaking melt season for extent. The honest framing is that a year which would have been shocking in the 1990s is now merely unremarkable — it sits comfortably inside the pack of recent years, all of which cluster far below the long-term average.
Both Poles Are Below Average at Once
The Antarctic, in the depth of its winter growth season, is also running short: 16.65 million km2 on 2 August, the 4th lowest on record for the date and 0.83 million km2 below average. Add the two hemispheres together and roughly 2.21 million km2 of sea ice is simply absent compared with the 1981–2010 baseline — an area close to the size of Greenland.
The Real Story Is Not Area. It Is Age.
Extent is the number that makes headlines, because it is easy to measure and easy to picture. But it describes a two-dimensional slice of a three-dimensional problem, and it hides the change that actually matters.
Sea ice that survives a summer melt season becomes multi-year ice. Each winter it thickens further. Ice that has lived through four or more summers can be several metres thick, dense and mechanically strong — the structural backbone of the ice pack, and the part that does not melt away in a single warm season.
According to NOAA’s Arctic Report Card 2025, that backbone has been dismantled:
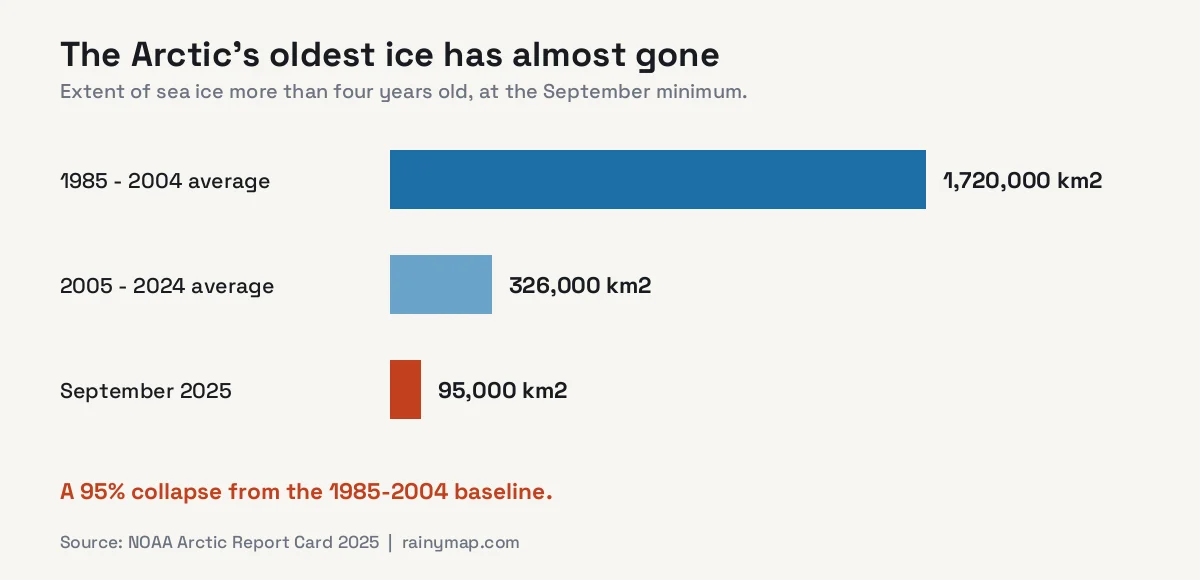
At the September 2025 minimum, ice more than four years old covered just 95,000 km2. The 2005–2024 average was 326,000 km2, so this is a 72% drop even against the recent, already-degraded norm. Against the 1985–2004 average of 1.72 million km2, it is a 95% collapse.
What remains is largely confined to a narrow band hugging the north coast of Greenland and the Canadian Arctic Archipelago. The Arctic Ocean has effectively transitioned from a permanent ice cover that renewed itself to a seasonal one that is rebuilt from scratch each winter — thinner, more mobile, and far easier to melt the following summer.
This is why extent alone can mislead. A year can post an unremarkable 9th-lowest extent while the ice that produced that number is younger and thinner than anything in the satellite era. Area recovers in a cold winter. Age takes decades.
Two Record-Low Winters, Back to Back
Summer minima get the attention, but the winter maximum is the more telling metric: it is the annual reset, the maximum the system can rebuild to before melting starts again.
In March 2025, the Arctic maximum came in at 14.12 million km2 as a monthly average — the lowest on record. In March 2026 it reached 14.29 million km2 on 15 March, statistically tied with 2025 as the joint-smallest in the 47-year satellite record. Two consecutive years at the floor. In February 2026, total Arctic sea ice volume was the second lowest ever measured, and ice near the North Pole sat at record-low thickness for several months.
Arctic sea ice is entering late winter in one of its weakest states in the satellite record.
Dr Zack Labe, Climate Central
The melt season is also starting earlier. Melt onset in 2025 began on 21 May, two days earlier than 2024, continuing a trend of roughly 4.1 days earlier per decade. An earlier start means more of the summer sun falls on dark open water rather than reflective ice.
Why the Arctic Warms Faster Than Everywhere Else
Since 2006 the Arctic has warmed at more than double the global rate. The period from October 2024 to September 2025 was the warmest in the Arctic since records began in 1900, and the last ten years form the warmest decade on record there.
The mechanism is a feedback loop, and it is worth understanding because it explains why the trend is so hard to reverse. Sea ice is bright: fresh snow-covered ice reflects most of the sunlight hitting it straight back to space. Open ocean is dark, and absorbs the large majority of it. Replace ice with water and the same sunlight now heats the system instead of bouncing off it.
Warmer air and ocean temperatures help melt the ice and, with less ice, the ocean absorbs more heat.
Dr Lettie Roach, Alfred Wegener Institute
That extra absorbed heat delays freeze-up in autumn, which means thinner ice going into winter, which melts out earlier the next spring, which exposes more dark water. Each turn of the loop makes the next turn easier. This is called ice-albedo feedback, and it is the single biggest reason the Arctic is an outlier rather than simply a colder version of everywhere else.
Where the Heat Actually Goes: The Ocean
On 11 August 2026 the American Meteorological Society published its 36th annual State of the Climate report, compiled by 625 scientists across 60 countries and covering the 2025 calendar year. Read alongside the Arctic data, it explains where the energy is accumulating.
- Ocean heat content from the surface down to 2,000 metres reached a new record high in 2025. The ocean absorbs the overwhelming majority of the excess heat trapped by greenhouse gases, which is why it is the most reliable single indicator of planetary warming.
- Global mean sea level set a record for the 14th consecutive year, reaching about 111.2 mm above the 1993 average.
- What is driving that rise: since 2005, melting ice sheets and glaciers have added roughly 2.0 ± 0.4 mm per year, while thermal expansion of warming seawater has contributed 1.6 ± 0.3 mm per year. Roughly speaking, about 45% of recent sea level rise is simply water expanding as it warms.
- Atmospheric CO2 averaged 425.6 ± 0.1 parts per million — 53% above the pre-industrial level of about 278 ppm.
- Fossil fuel emissions reached 10.3 ± 0.5 petagrams of carbon in 2025, more than three times the 3.0 ± 0.2 petagrams per year of the 1960s.
Sea level is the clearest illustration of why these systems are linked. Melting sea ice does not raise sea level, because floating ice already displaces its own weight. But the warming that melts it also expands the ocean and melts land-based ice, and those do. The Arctic is the visible symptom; the ocean is where the energy is being stored.
Greenland, Permafrost and the Orange Rivers
The Greenland Ice Sheet lost an estimated 129 billion tonnes of ice in 2025. That is a real loss, but notably below the 2003–2024 annual average of 219 billion tonnes — a reminder that individual years vary and that not every metric moves in the same direction at once.
One of the stranger findings in the 2025 Arctic Report Card is visible from the air. Across more than 200 watersheds in Arctic Alaska, rivers and streams have turned orange over the past decade. As permafrost thaws it exposes long-frozen minerals to oxygen and water, releasing iron and other metals into waterways that were pristine within living memory. It is an unusually literal illustration of a warming Arctic: the ground itself is changing colour.
The Arctic Report Card 2025 was produced by 112 scientists across 13 countries, supported by NOAA, with peer review facilitated by the Arctic Monitoring and Assessment Programme.
What to Watch: The September Minimum
Arctic sea ice bottoms out in mid-to-late September. The Met Office’s statistical projections for the 2026 minimum span a wide range — roughly 3.98 to 5.45 million km2 depending on the method used. For comparison, the September 2025 minimum was 4.75 million km2 as a monthly average (11th lowest) and 4.60 million km2 at the daily low point (10th lowest of 47 years).
That spread is unusually wide because late-season weather matters enormously. A persistent storm can break up and disperse thin ice quickly; a cool, calm August can slow melt to a crawl. With ice this thin, the final number is more weather-dependent than it used to be — which is itself a symptom of a degraded ice pack.
The more useful question is not whether 2026 sets a record. It is whether the pack can still rebuild multi-year ice at all. On current evidence, it largely cannot.
How This Connects to the Rest of 2026
None of this sits in isolation. The same accumulated heat shows up in our tracker on whether 2026 will be the hottest year ever recorded, in Europe’s record drought and the Rhine at its lowest level since 1880, and in America’s second heat dome of 2026. The El Niño pattern currently in place adds a temporary boost on top of the underlying trend, which is part of why so many indicators are peaking at once.
There is also a mid-latitude connection that is still actively debated among researchers. A warmer Arctic reduces the temperature difference between the pole and the tropics, and that difference is what drives the jet stream. A weaker gradient may make the jet stream wavier and slower-moving, which would favour stalled weather patterns — the heat domes, stuck troughs and repeat-rainfall events that produce records elsewhere. The physical reasoning is sound, but the strength of the effect remains genuinely contested in the literature, and it is worth treating with more caution than the sea ice numbers themselves.
Track Conditions Yourself
Sea ice moves on a seasonal timescale, but the weather driving it changes hourly. Our live temperature map shows current air temperature anywhere on Earth, including the high Arctic, and the live wind map shows the storm systems that break up thin ice late in the melt season. For precipitation and the systems moving across the northern hemisphere, use the live rain map or the 7-day forecast.
Frequently Asked Questions
How much Arctic sea ice is there right now?
On 2 August 2026 Arctic sea ice extent was 7.02 million square kilometres, the 9th lowest for that date in the 47-year satellite record and 1.38 million square kilometres below the 1981–2010 average. The record low for the date is 6.30 million km2, set in 2020.
Why does the age of sea ice matter more than the area?
Ice that survives several summers grows thick and structurally strong, and does not melt out in a single warm season. Extent measures only surface area, so a pack made entirely of thin first-year ice can post a normal-looking extent while being far more fragile. Ice older than four years has fallen 95% from its 1985–2004 average, to just 95,000 km2 in September 2025.
Does melting sea ice raise sea level?
No. Sea ice already floats, so it displaces its own weight and melting it does not change sea level. Sea level rise comes from land-based ice — glaciers and ice sheets like Greenland’s — and from thermal expansion as seawater warms. Since 2005 those have contributed about 2.0 mm and 1.6 mm per year respectively.
How much faster is the Arctic warming than the rest of the planet?
Since 2006 the Arctic has warmed at more than double the global average rate, according to NOAA’s Arctic Report Card. The main driver is ice-albedo feedback: bright ice reflects sunlight, dark open water absorbs it, so each loss of ice accelerates further warming.
Is Antarctic sea ice also declining?
Currently yes. On 2 August 2026 Antarctic extent was 16.65 million km2, the 4th lowest on record for the date and 0.83 million km2 below average. Antarctic sea ice historically showed more year-to-year variability than the Arctic, but recent years have run consistently low.
Why are Arctic rivers turning orange?
Thawing permafrost exposes long-frozen minerals to oxygen and water, releasing iron and other metals into rivers and streams. More than 200 watersheds across Arctic Alaska have visibly changed colour over the past decade as a result.
Sources
- Met Office — Briefing on Arctic and Antarctic sea ice, August 2026 (Alex West & Ed Blockley)
- NOAA Arctic Report Card 2025 — Sea Ice
- WMO — Arctic Report Card marks 20 years amid record warming
- Carbon Brief — Arctic sea ice hits record low for second year running
- AMS State of the Climate 2025 — emissions, sea level and ocean heat reach record highs
- NSIDC — Why is Arctic sea ice getting younger?