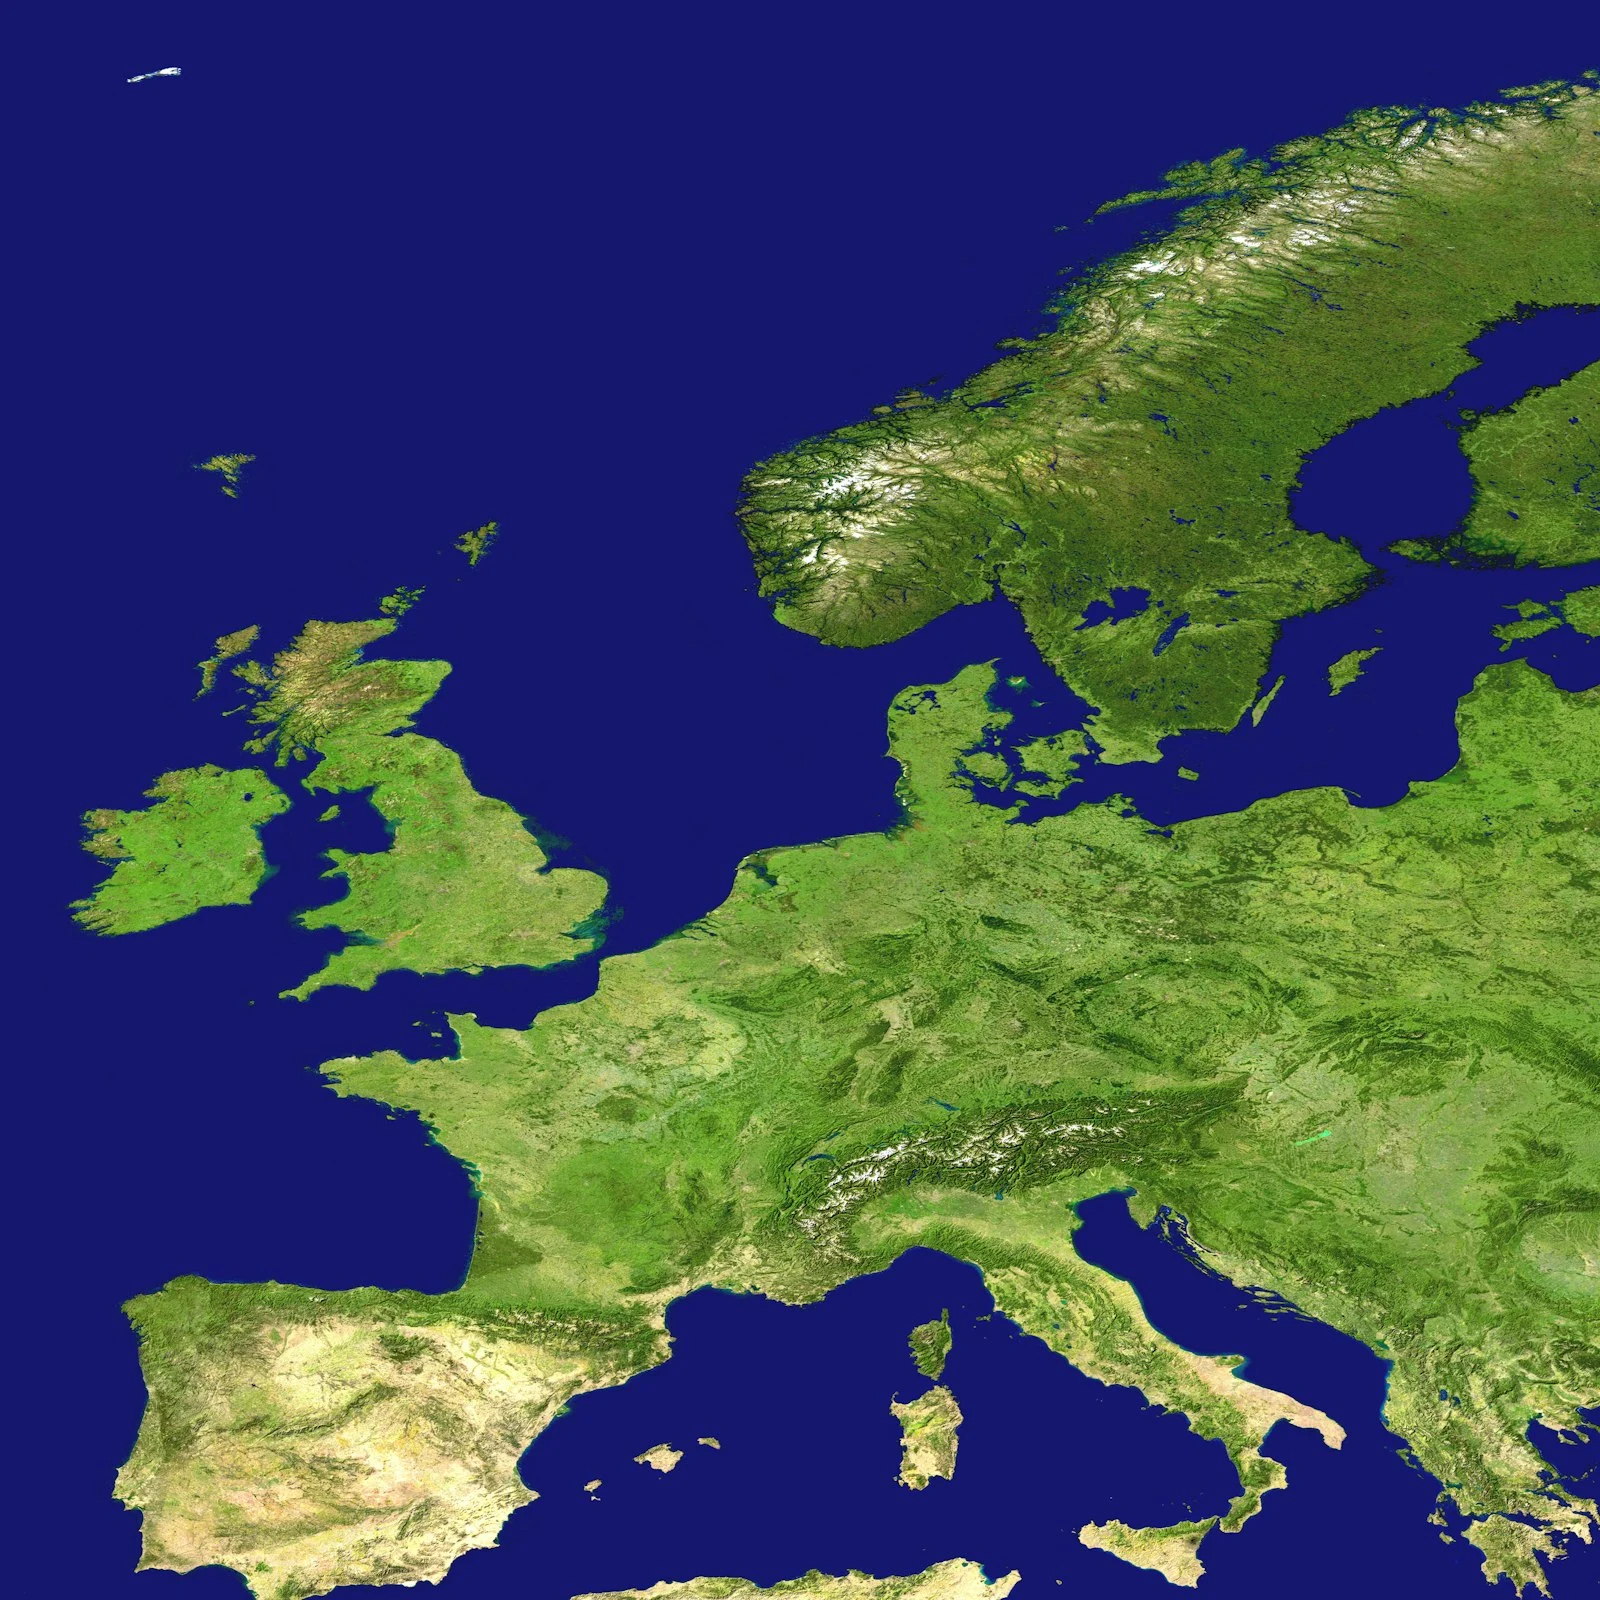
A severe heatwave pushed land surface temperatures above 50°C (122°F) in parts of France and Spain in June 2026, and by early July more than 1,300 excess deaths linked to the heat had been recorded across Europe.
Europe Is Warming Faster Than Almost Anywhere Else
Europe is the fastest-warming continent on record, with average temperatures rising about 0.56°C per decade since the mid-1990s, more than double the global average rate. That trend means heatwaves that once would have been rare extremes are becoming a recurring summer feature, arriving earlier, lasting longer, and hitting harder each year.
The Wider Pattern: A Connected Atmosphere
Scientists tie this year’s European heat to a larger chain of events stretching from the tropical Pacific Ocean to South Asia. At the same time Europe baked, India’s monsoon was running below its Long Period Average, with July rainfall tracking near 94% of normal even as temperatures stayed above average across most of the country. It’s a reminder that heat and rainfall anomalies on opposite sides of the globe are often part of the same large-scale atmospheric pattern, not isolated coincidences.
Why This Matters for Everyday Forecasting
Large-scale heat events change how storms form at the margins. Hot, dry ground can supercharge afternoon thunderstorm development when a cold front finally arrives, and dry-lightning outbreaks become more likely in drought-stressed regions. Keeping an eye on live rain radar during and after a heatwave helps you catch these fast-forming storms, since the same stagnant weather pattern that causes extreme heat can flip into severe convection with surprisingly little warning once it finally breaks. If storms do develop, understanding what causes thunderstorms can help you judge how serious a system might become.
In Conclusion
Heatwaves are no longer local news; they’re regional and increasingly global patterns worth watching with the same tools you’d use to track a storm.
Update: The Heatwave Became a Record Drought
Updated 3 September 2026. The article above was written in early July, when the story was still about temperature. By late August it had become a story about water.
The heat did not break — it compounded. Five successive heatwaves through June and July, on top of a dry spring, produced one of the most severe droughts in modern European history.
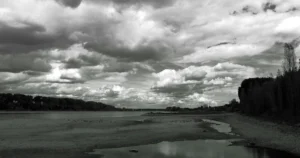
- The Rhine fell to its lowest level since records began in 1880, disrupting the barge traffic that moves coal, chemicals and grain through Germany’s industrial core.
- The Loire, Po and Danube also hit record lows.
- Around half of EU and UK territory came under drought warning or alert.
- Wildfires burned more than 505,000 hectares.
- More than a fifth of France’s nuclear generating capacity was lost, as rivers ran too warm and too low to provide cooling water.
- “Hunger stones” carved in previous centuries to mark catastrophic low water re-emerged in the Elbe.
The full analysis is in Europe’s 2026 Drought, including the counter-intuitive finding that this drought covered less territory than 2022 while breaking records 2022 did not.
The warming figure, in context
The 0.56°C per decade in the original article — more than double the global rate — is what makes this sequence coherent rather than coincidental. A drought of this severity requires heat to arrive early, repeatedly, and on already-dry ground. Each of those conditions has become more likely.
The same underlying warming is visible at the poles, where Arctic ice older than four years has collapsed by 95% since the 1980s.
What the connected-atmosphere argument got right
The original article argued that European heat and a weak Indian monsoon were parts of one large-scale pattern rather than unrelated events. That framing held: the El Niño conditions in play through 2026 suppressed the Atlantic hurricane season to three named storms and zero hurricanes while the north-west Pacific recorded 19 typhoons. Our ENSO explainer covers how one pattern produces opposite effects in different basins.
One caution worth adding. Attribution is stronger for some hazards than others. Heatwaves and droughts are among the events most confidently linked to warming, because the physical chain is direct and well modelled. That confidence does not transfer automatically to every kind of extreme weather — tornado frequency, for instance, remains genuinely unclear.