Live Snow Map: Radar, Snow Forecast and Snow Depth
This live snow map shows where snow is falling right now, how much fresh snow is forecast over the next five days, how deep it already lies, and where NASA satellites saw snow on the ground. Pick a layer with the tabs, search any town, or press Use My Location.
How to readPale blue is snow, other colours are rain. Press ▶ in the map to play the last 2 hours.
Where is it snowing right now?
The list below checks 60 snowy cities across North America, Europe and Asia every hour and shows where the forecast for this hour is snow or sleet. To confirm it, open the Snow radar tab: falling snow appears there in its own pale-blue colours, separate from rain.
3 of the 60 cities we track have snow in the forecast for this hour, and 4 have sleet:
- Winnipeg snow · -2°C
- Whistler snow · -2°C
- Stockholm snow · 2°C
- Riga sleet · 3°C
- Vilnius sleet · 3°C
- Zermatt sleet · 1°C
- Moscow sleet · 2°C
Updated 12:17 UTC, 22 Nov 2026 · 60 winter cities · MET Norway forecast data
Which cities get the most snow in the next 7 days?
These are the 12 tracked cities with the most fresh snow in the forecast. The numbers are our own sums of MET Norway’s hour-by-hour forecast, counting only the hours when the precipitation is forecast to fall as snow.
| City | Next 24 h | Next 3 days | Next 7 days | Snowiest day | Coldest |
|---|---|---|---|---|---|
| ZermattSwitzerland | 13 cm 5.1″ | 27 cm 11″ | 33 cm 13″ | Wed | -13°C |
| Quebec CityCanada | 0 | 0 | 23 cm 9.1″ | Fri | -5°C |
| OttawaCanada | 0 | 0 | 23 cm 9.0″ | Fri | -3°C |
| MontrealCanada | 0 | 0 | 22 cm 8.6″ | Fri | -3°C |
| ChamonixFrance | 3.5 cm 1.4″ | 13 cm 5.2″ | 21 cm 8.3″ | Wed | -7°C |
| MoscowRussia | 1.9 cm 0.7″ | 15 cm 6.0″ | 18 cm 7.0″ | Wed | -5°C |
| MunichGermany | 0 | 0 | 16 cm 6.4″ | Thu | -8°C |
| ViennaAustria | 0 | 0 | 12 cm 4.7″ | Thu | -8°C |
| BucharestRomania | 0 | 0 | 11 cm 4.3″ | Sat | -2°C |
| PragueCzechia | 0 | 0 | 9.4 cm 3.7″ | Thu | -10°C |
| AnchorageUnited States | 0 | 0 | 5.2 cm 2.0″ | Sat | -9°C |
| AspenUnited States | 0 | 1.3 cm 0.5″ | 4.5 cm 1.8″ | Sat | -15°C |
How much snow will fall where you are?
Type a town or ski resort, or use your location, to see fresh snow day by day for the coming week. Days with rain or sleet near freezing are flagged as mix, because that is where forecasts most often flip between rain and snow. For temperature, wind and rain in the same place, open the full 7-day weather forecast for any city.
Loading the snow forecast…
Fresh snow in cm at 10:1 from MET Norway forecast data (CC BY 4.0). “Mix” = rain or sleet forecast at 1°C or colder, which can fall as wet snow.
Which snow map should you use?
Each tab answers a different question. The radar shows what is falling now, the two forecast layers show what is coming and what is already on the ground, and the satellite view checks the models against reality.
| Layer | What it shows | Data | Updates | Best for |
|---|---|---|---|---|
| Snow radar | Snow and rain detected in the last 2 hours, animated | National weather radars, via RainViewer | About every 10 minutes | Is it snowing here now, and which way is the band moving? |
| New snow | Fresh snow expected over the next 12 hours to 5 days | ECMWF forecast model, via Windy | Several times a day | Will it snow this weekend, and how much? |
| Snow depth | Total snow lying on the ground | ECMWF forecast model, via Windy | Several times a day | Ski trips, mountain roads, whether old snow has melted |
| Satellite | Snow seen from space on cloud-free days | NASA VIIRS on the NOAA-20 satellite | Once a day | Checking where snow really lies after a storm |
Where is snow on the ground this week?
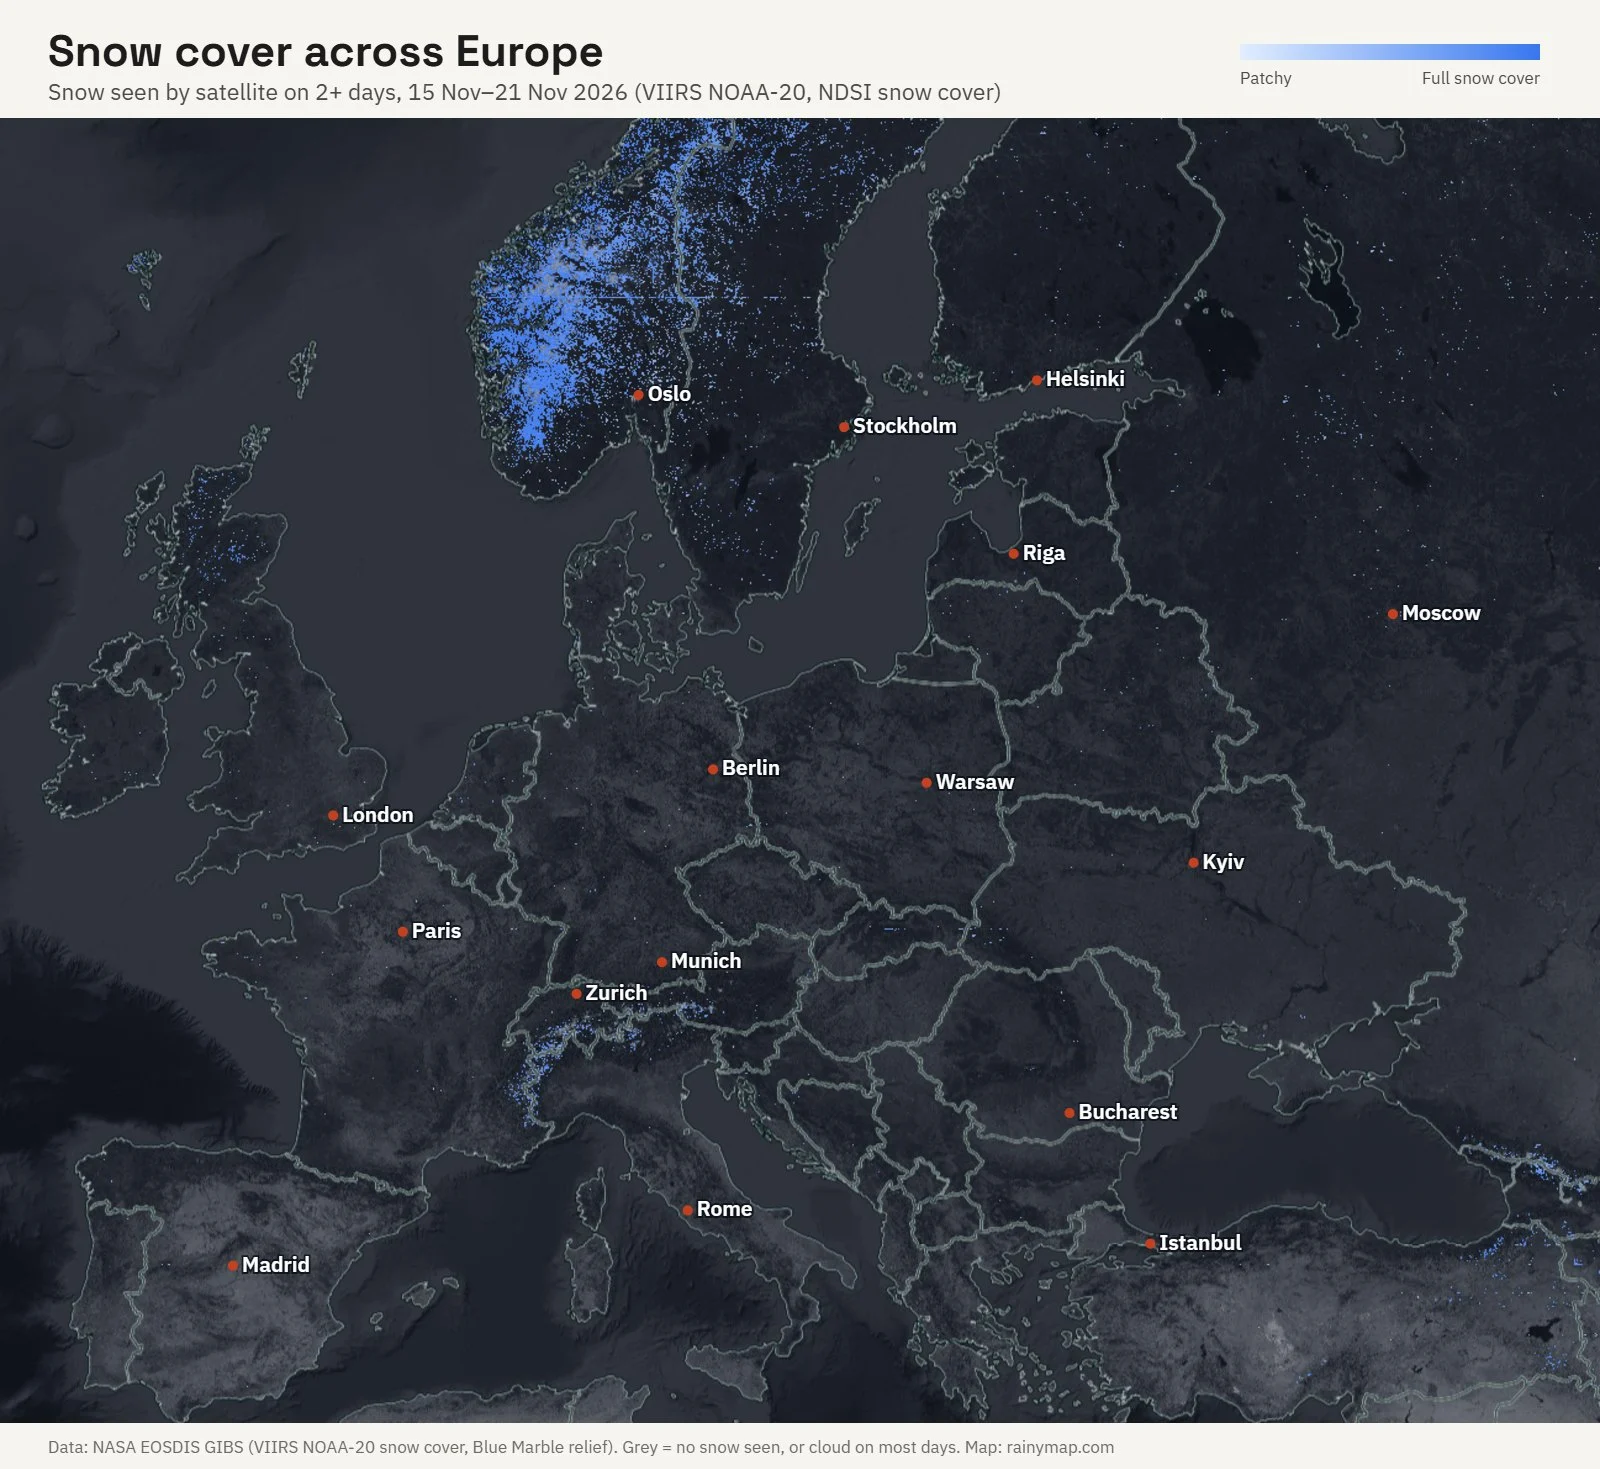
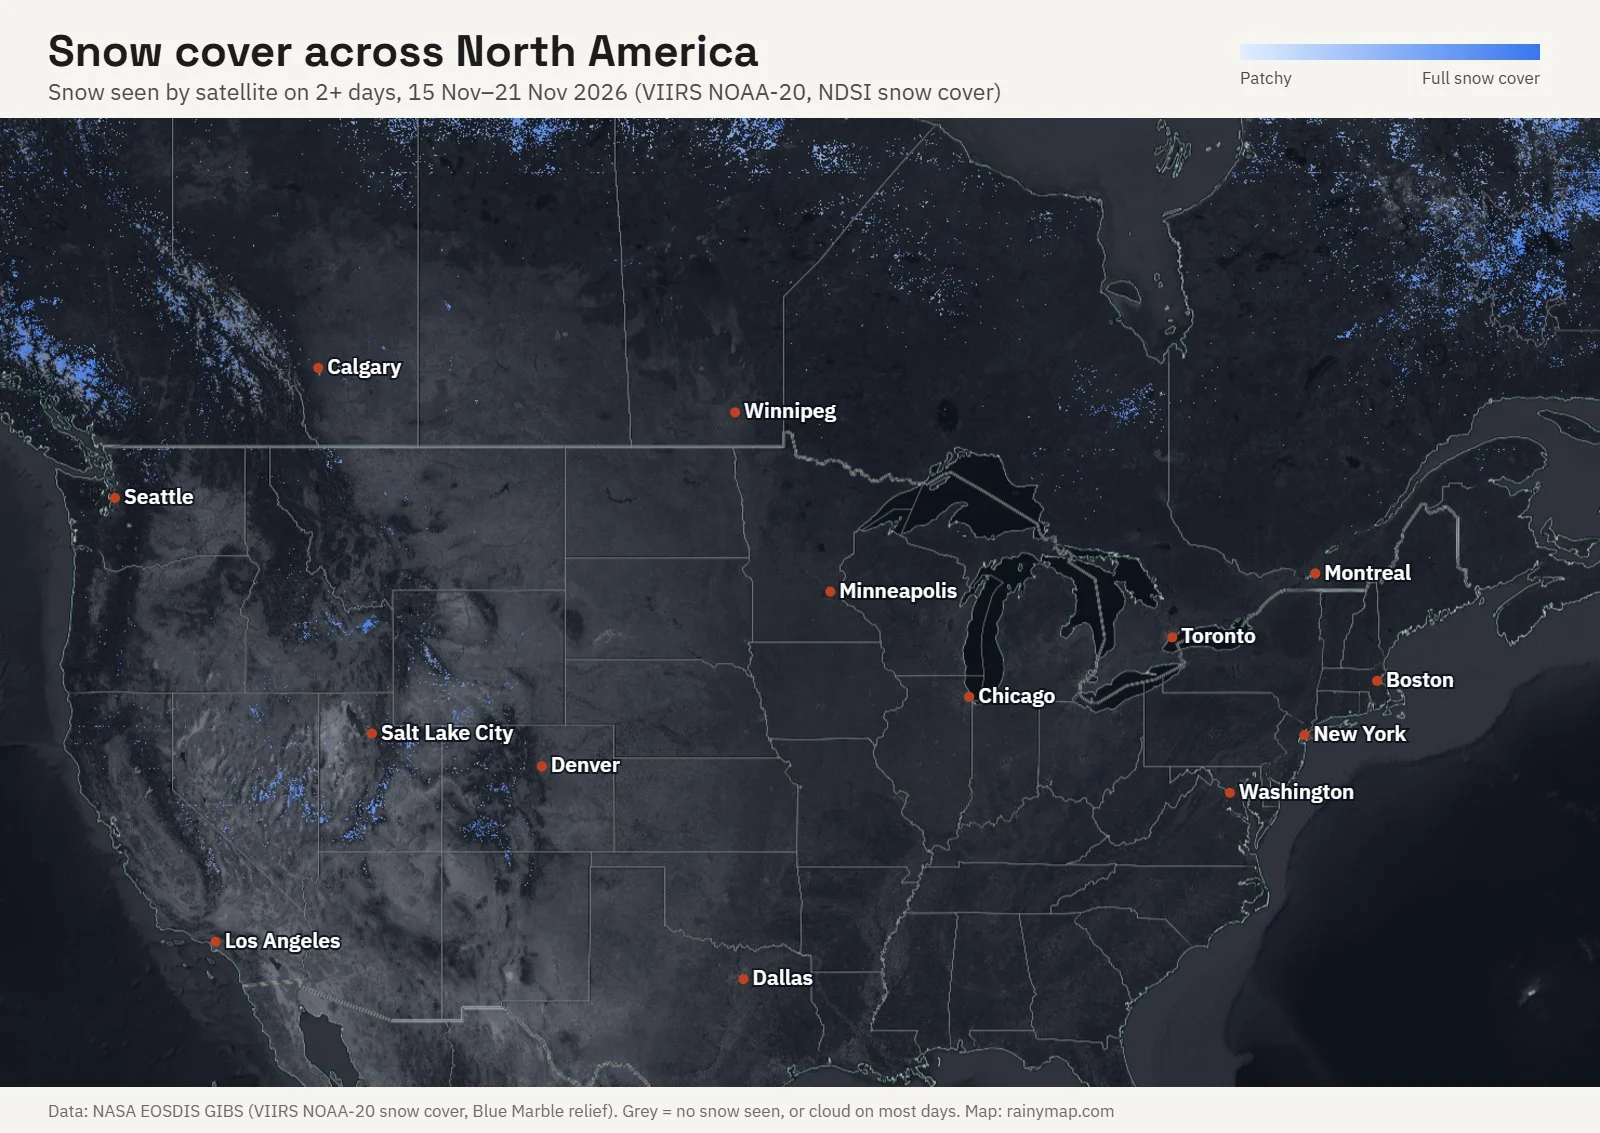
We stacked seven daily NASA satellite passes from 15 to 21 November 2026 and kept every spot that showed snow on at least two days. In Europe, the snow sat on the Norwegian mountains, the Alps and the high ground of eastern Turkey. The lowlands from London to Warsaw showed no lasting snow on clear days.
In North America the week’s snow covered the Rocky Mountains from Colorado to Wyoming, the Coast Mountains of British Columbia and much of northern Quebec. The Great Lakes cities and the Northeast showed no lasting snow yet.
How do you read snow on a weather radar?
A weather radar sends out microwave pulses and measures what bounces back. Snowflakes return a weaker echo than raindrops, so light snow looks faint on the map and very light snow may not show at all. A pale band on the radar can still mean steady snow on the ground. Our guide to radar reflectivity and dBZ values explains the scale.
The Snow radar tab draws snow in its own pale-blue palette, so you can tell it apart from rain. When we checked on 22 November 2026, the snow falling over Stockholm and the nearby Baltic coast showed as pale-blue bands.
A bright ring or blotch near the freezing level is often the bright band: melting snowflakes coated in water look much heavier to the radar than they are. Treat sudden bright colours in a winter storm with care, and check the temperature first.
Why does the radar show snow when nothing is falling?
The radar beam climbs as it travels. For the usual lowest scan it sits about 1.5 km above the ground 100 km from the radar and about 4 km up at 200 km. Snow seen up there can evaporate in dry air before it lands, which forecasters call virga.
The opposite happens in the mountains. Peaks block the beam, and shallow snow clouds can sit underneath it, so it can snow hard in a valley with nothing on the map. Read more on why mountains and distance hide precipitation from radar, and in our longer answer to whether weather radar can track snow accurately.
Will it snow or rain? The rain–snow line explained
Whether precipitation lands as snow depends on the temperature of the whole column of air, not just the reading at the ground. Snow can reach the ground at 1 or 2 °C when the air above is cold and dry, while a warm layer aloft turns it into sleet or freezing rain even when the ground is below zero.
That is why the snow forecast above flags rain at 1 °C or colder as mix. For the temperatures behind a storm, compare this map with the live air temperature map, and use the real-time rain map to follow the wet side of the same system.
How much snow does 1 mm of rain make?
The usual rule is 10 to 1: 1 mm of melted water makes about 1 cm of fresh snow, and 1 inch of water makes about 10 inches. The real ratio depends on temperature and wind, so treat any snow total as a range.
| Type of snow | Typical conditions | Snow-to-liquid ratio | Snow from 10 mm of water |
|---|---|---|---|
| Wet, heavy snow | Around 0 °C | 5:1 to 8:1 | 5 to 8 cm |
| Average snow | A few degrees below 0 °C | 10:1 | 10 cm |
| Light, fluffy snow | Near −10 °C with light wind | 15:1 to 20:1 | 15 to 20 cm |
NOAA’s Weather Prediction Center notes that the fluffiest snow falls near −9.5 °C with light winds, and that in very cold air the crystals get smaller and pack closer, bringing the ratio back down to about 10 to 1. Our city numbers use 10 to 1 throughout, so expect more in very cold dry snow and less in wet snow near freezing.
Where does the snow data come from?
- Snow radar: national weather radar networks, combined and drawn by RainViewer.
- New snow and snow depth: the ECMWF global forecast model, drawn by Windy.
- City snow lists and the snow forecast: the MET Norway Locationforecast (CC BY 4.0), summed by RainyMap every hour.
- Satellite snow cover: the daily NDSI snow cover product from the VIIRS instrument on NOAA-20, served by NASA’s Global Imagery Browse Services.
For the bigger picture this winter, see what a strong El Niño means in our 2026 El Niño winter outlook.
Frequently Asked Questions
Is this snow map free?
Yes. All four layers, the city snow lists and the snow forecast are free in any browser, with no account and no app.
How often does the snow radar update?
The radar layer refreshes about every 10 minutes and animates the last 2 hours. The city snow lists update every hour, the forecast layers several times a day, and the satellite view once a day.
What colour is snow on the radar?
On the Snow radar tab, snow is drawn in pale blues, from light blue for light snow to deeper blue for heavier bands. Rain keeps its usual colours, so a change of colour along a storm shows roughly where the rain turns to snow.
Can I use this snow map for ski resorts?
Yes. Search the resort town in the snow forecast to get fresh snow day by day, then check the Snow depth tab for what is already lying. Radar is least reliable in the mountains, so lean on the forecast layers there.
What is the difference between new snow and snow depth?
New snow is the fresh snow expected to fall over a period, such as the next 3 days. Snow depth is everything already on the ground, including older snow that has settled or partly melted.
How accurate are snow forecasts?
The timing of a storm is usually right a few days out, but the amount is harder because a 1 °C change can turn snow into rain. Check the forecast again the day before, and watch the radar on the day.
Why does the satellite view miss some snow?
The satellite sees the ground only where the sky is clear, and it needs daylight. Under cloud, or in the far north in winter, snow can be there without showing, so a gap in the blue is not proof of bare ground.