Last updated: 4 October 2026. Map details checked against the live Blitzortung map used on RainyMap; safety guidance from NOAA’s National Weather Service.
Quick Answer
On a live lightning map, every dot is one lightning strike, and its colour tells you how long ago it happened. On the Blitzortung map used by RainyMap’s live lightning map, strikes are white for the last 20 minutes, then yellow (20–40 min), amber (40–60 min), orange-red (60–80 min), red (80–100 min) and dark red (100–120 min), after which they disappear. That colour scale is what the legend means by “age of lightning (minutes)”. A circle that shrinks onto a point marks a strike that has just happened. New strikes usually appear within 3 to 20 seconds. To see where a storm is heading, follow the colours from dark red to white. To see how close it is to you, count the seconds between flash and thunder: every 5 seconds is about one mile (3 seconds is about 1 km). If you can hear thunder at all, you are within striking distance and should go indoors.
The Key Points
- Dots are strikes, colours are age. White means the last 20 minutes; dark red means up to two hours ago.
- The map keeps a two-hour history, in six 20-minute colour steps.
- Converging circles mark a strike that has just been detected.
- Strikes appear within about 3–20 seconds, according to the Blitzortung network that supplies the data.
- Location comes from radio timing: more than 500 volunteer detectors time each strike’s radio burst with GPS clocks.
- Accuracy depends on where you are. It is best where detectors are dense and weaker where they are sparse. Switch on the map’s coverage layer to check your area.
- Not a safety device. The map’s own disclaimer says not to use it to protect people or equipment. Thunder is the warning that counts.
The Colour Key: What “Age of Lightning (Minutes)” Means
The most common question about any live lightning map is what the colours mean. On the map we use, the answer comes straight from the map itself: “The colors represent the age from now (white) to past (dark red) in 20 minutes time ranges.” The map holds the last 120 minutes, so there are exactly six colours.
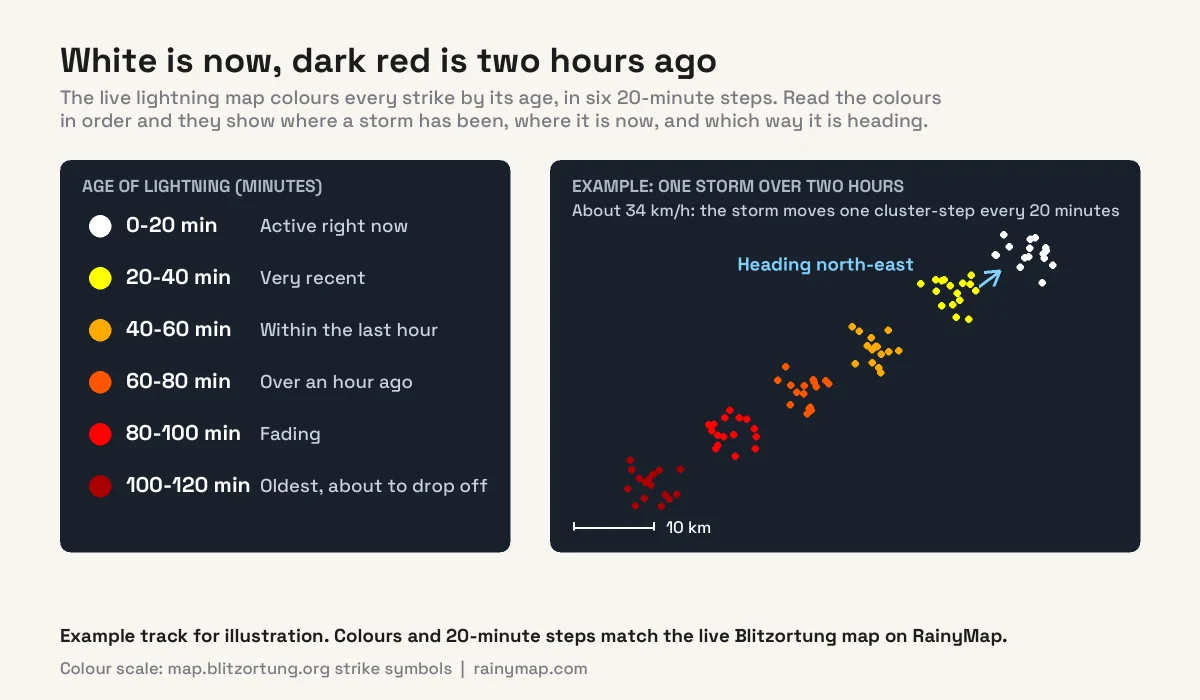
| Colour | Strike age | What it tells you |
|---|---|---|
| White | 0–20 minutes | The storm is active here right now |
| Yellow | 20–40 minutes | Very recent; the storm has just moved on or is still nearby |
| Amber | 40–60 minutes | Within the last hour |
| Orange-red | 60–80 minutes | More than an hour ago |
| Red | 80–100 minutes | Fading history |
| Dark red | 100–120 minutes | The oldest strikes, about to drop off the map |
The one mistake almost everyone makes: reading red as “dangerous”. On a strike-age map, red is the oldest lightning. White is the freshest. A field of dark red dots over your town means a storm passed through an hour and a half ago; a cluster of white dots means it is happening now.
Every Other Symbol on the Map, Explained
The live map can show several layers besides the strikes themselves. Here is what each one does, using the map’s own descriptions:
- Converging circles: a ring that shrinks onto a point. The map “marks the strike impact locations by converging circles”, so this is the newest strike arriving. It is the easiest way to spot where lightning is happening this second.
- Detector links: thin lines from a fresh strike out to the stations that heard it. The map “draws lines to the detectors that received the strike event”. Many long lines mean a well-measured strike.
- Detectors: markers for the receiving stations themselves. These are not lightning, so don’t mistake them for strikes.
- Coverage: a green shading showing how densely detectors cover each area. Dense coverage means more strikes detected and better positions.
- Counting circles: grey circles with a number that “counts the number of strikes within certain circled areas”, a quick way to compare how active two storms are.
- Night shading: darker areas show where it is currently night. Lightning activity over land tends to peak in the afternoon and evening.
- Time course: plays back the strikes of the last two hours as an animation, which makes a storm’s movement obvious.
- Sound: the map can play a click for each strike it receives.
- Scale bar: the distance bar in the corner, which you need for working out a storm’s speed (below).
How to Tell Which Way a Storm Is Moving, and How Fast
Because the colours are a clock, a moving thunderstorm leaves a trail: dark red where it was two hours ago, then red, orange and yellow, and white where it is now. Reading the trail takes four steps:
- Find the white cluster. That is the storm’s current position.
- Find the yellow cluster. That is where it was 20 minutes earlier.
- Draw an imaginary line from yellow to white. That is the direction of travel. If the line points at you, the storm is coming your way.
- Measure the gap with the scale bar and multiply by three to get kilometres (or miles) per hour, since 20 minutes is a third of an hour. In the example graphic above, the clusters are about 11 km apart, so the storm moves at roughly 34 km/h.
Two cautions. Storms do not always move in straight lines: new cells can pop up ahead of or beside the old ones, so a trail can jump. And a cluster that stays white and keeps growing in the same place is a stationary storm, which is often the one that causes flash flooding. Pair the lightning map with our live rain map to see the rain that comes with it.
How Lightning Detection Works
No camera watches every storm. Ground-based lightning maps work by listening. Every lightning discharge releases a powerful burst of radio waves, strongest in the very low frequency (VLF) band of 3 to 30 kHz, which can travel thousands of kilometres.
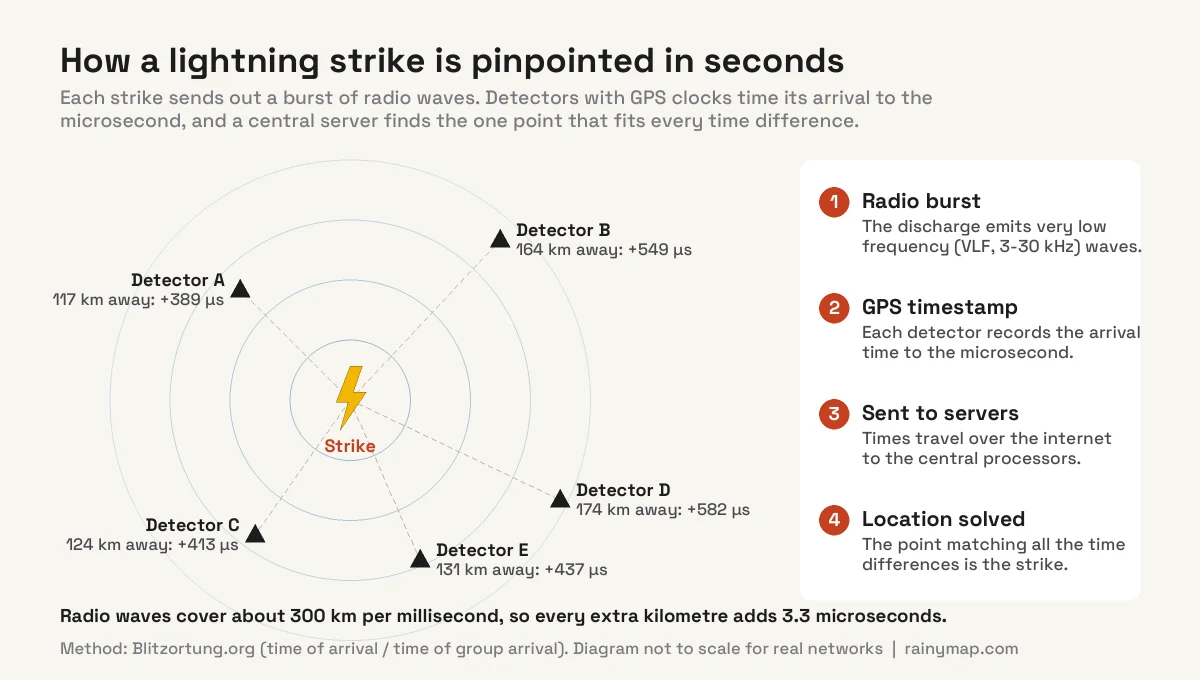
The Blitzortung network behind our map has more than 500 receivers run by volunteers. Each one records about a millisecond of every signal and stamps its arrival time using GPS, to microsecond precision. The times are sent over the internet to central servers, which use the time of arrival and time of group arrival methods to work out where the strike must have been. Radio waves cover about 300 km per millisecond, so a detector 100 km further away hears the strike about 334 microseconds later. Those tiny differences are enough to pin down the location. According to Blitzortung, the whole process takes on average between 3 and 20 seconds.
Professional networks such as Vaisala’s National Lightning Detection Network in the United States use similar radio techniques with purpose-built sensors. Satellites take a different approach: the Geostationary Lightning Mapper on NOAA’s GOES satellites and the Lightning Imager on Europe’s Meteosat Third Generation watch for the flashes of light from orbit.
How Accurate Are Live Lightning Maps?
It depends on the network and on where you are. Here is how the main systems compare, using their operators’ and researchers’ published figures:
| Network | How it detects | Coverage | Published performance |
|---|---|---|---|
| Blitzortung (used on RainyMap) | Volunteer VLF radio receivers, GPS-timed | Worldwide, densest where volunteers host stations | 500+ receivers; 3–20 second delay; accuracy varies with detector density |
| NLDN (Vaisala) | Commercial radio sensors | Contiguous United States | Over 95% of cloud-to-ground flashes; median location accuracy better than 150 m |
| WWLLN (University of Washington) | Global VLF network | Worldwide | Detects a small share of all strokes but 30–40% of powerful ones; median error around 3 km |
| GOES GLM (NOAA) | Optical camera in geostationary orbit | The Americas and nearby oceans | All lightning, in cloud and to ground; 8–14 km resolution; 70–90% of flashes; under 20 s latency |
| MTG Lightning Imager (EUMETSAT) | Four high-speed cameras in geostationary orbit | Europe, Africa, the Middle East, part of South America | 1,000 images per second; fully operational since 31 October 2024 |
For a community network, the honest answer is that accuracy is best where many detectors surround a storm and weaker over oceans or in regions with few stations. That is why the coverage layer matters: if your area is pale on it, treat both the positions and the strike counts with caution. The Blitzortung map itself carries a clear disclaimer: it is “for entertainment purposes only”, and the displayed impact and storm locations “may be subject to errors”.
Why different lightning maps show different numbers
If you compare two trackers during the same storm, their strike counts will rarely match. That is expected. Roughly three out of four lightning flashes never reach the ground; they stay inside or between clouds. Ground-based radio networks pick up mainly the stronger discharges, while satellites see the light of most flashes, in cloud and to ground, but with coarser positions. Each network also has its own coverage gaps and its own way of grouping strokes into flashes. Our lightning map page explains why tracker counts differ in more detail.
Lightning Map, Lightning Radar or Weather Radar?
People often search for a “lightning radar”, but weather radar does not see lightning at all. Radar sends out microwave pulses and measures what bounces back from raindrops, hail and snow, so it shows precipitation. Lightning maps come from a completely different system: radio detectors and satellites. “Lightning radar”, “lightning tracker”, “thunder map” and “lightning strike map” all describe the same thing: a map of detected strikes.
The two work best together. Radar shows you the storm’s rain and its structure; the lightning map shows you which parts of it are electrically active. A heavy shower with no lightning is a nuisance; a storm cell with a dense white cluster is the one to take seriously. On RainyMap you can switch between the rain map and the lightning map, or check where it is raining right now around the world.
How Far Away Is the Lightning? Count the Seconds
A map tells you where strikes are being detected, but your own senses give the quickest distance check. Light reaches you almost instantly, while sound is much slower. The National Weather Service explains that thunder takes about 5 seconds to travel a mile: count the seconds from the flash to the thunder and divide by 5 for miles, or by 3 for kilometres.
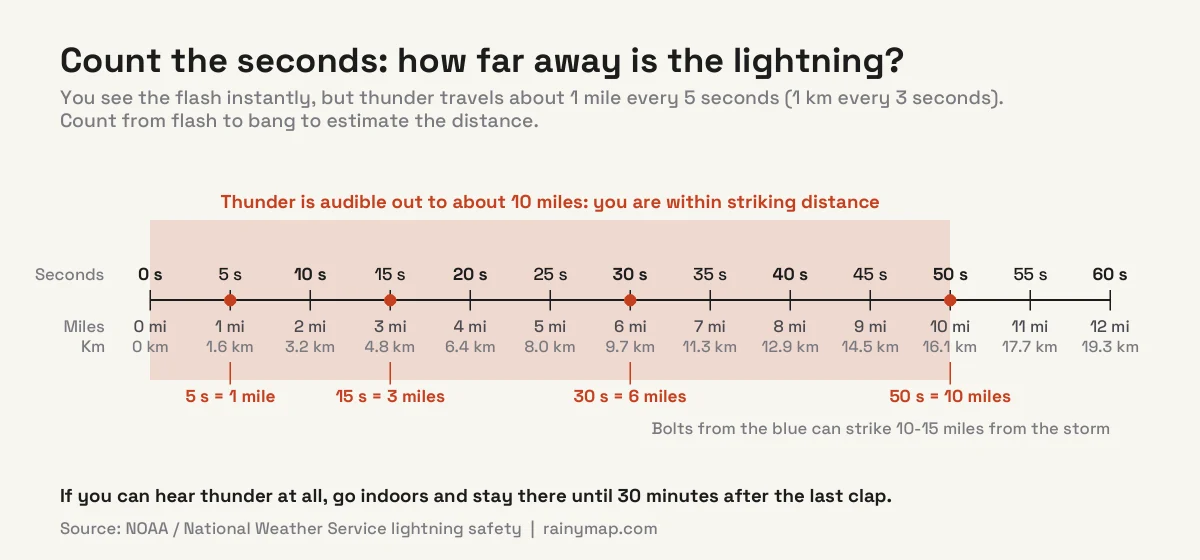
Thunder can only be heard about 10 miles (16 km) from a strike, and that is also roughly how far lightning can reach. According to the National Weather Service, lightning often strikes more than three miles from the centre of a thunderstorm, and so-called bolts from the blue can strike 10–15 miles away, under clear sky. So if you can hear thunder at all, you are close enough to be struck.
When to Trust the Map, and When Not To
A live lightning map is a superb tool for watching storms develop, planning around them and understanding the weather. It is not a personal safety alarm. There is a delay of seconds before a strike appears, coverage has gaps, and a storm can produce its first strike right above you. NOAA’s guidance is simple: “When thunder roars, go indoors”, and stay inside a building or a fully enclosed vehicle until 30 minutes after the last clap of thunder. Do not wait for the rain to start, and do not go back out just because it has stopped. Lightning kills about 20 people in the United States in a typical year, according to the National Weather Service.
Five common mistakes when reading a lightning map
- Reading red as danger. Red and dark red are the oldest strikes. White is the freshest.
- Assuming no dots means no risk. The first strike of a new storm can come without warning, and areas with few detectors may miss strikes.
- Confusing detectors with strikes. Station markers and coverage shading are not lightning.
- Judging local risk zoomed out. At continental zoom, dots merge into blobs. Zoom in on your area and use the scale bar.
- Expecting two maps to agree. Different networks detect different shares of flashes, so their counts differ.
Lightning by the Numbers
- About 44 flashes every second worldwide, or roughly 1.4 billion a year, according to NASA satellite measurements.
- About ten times more lightning over land than over the oceans, because land heats up faster and drives stronger updrafts.
- Roughly three-quarters of flashes stay in the clouds and never touch the ground.
- Lightning does strike the same place twice. It often hits tall, isolated objects again and again; see our lightning myths, debunked.
- The busiest lightning zones are in the tropics, where heat and humidity fuel thunderstorms almost daily in the wet season. Singapore is often called one of the world’s lightning capitals; see our Singapore weather guide.
Frequently Asked Questions
What do the colours on a lightning map mean?
The colours show how long ago each strike happened. On the Blitzortung map used by RainyMap, white is the last 20 minutes, then yellow (20–40 minutes), amber (40–60), orange-red (60–80), red (80–100) and dark red (100–120 minutes). After two hours, strikes disappear from the map.
What does “age of lightning (minutes)” mean?
It is the label for the colour scale: the number of minutes since a strike was detected. Each colour covers a 20-minute range, from white (just now) to dark red (up to 120 minutes ago).
Is red lightning on the map more dangerous?
No. On a strike-age map, red and dark red are the oldest strikes, up to two hours old. White strikes are the newest and show where a storm is active right now.
What are the circles on a live lightning map?
A circle that shrinks onto a point marks a strike that has just been detected; the map describes them as converging circles. Grey circles with numbers are a separate counting layer that shows how many strikes fell inside each circle.
How often does a live lightning map update?
The Blitzortung network says strikes reach its map with an average delay of between 3 and 20 seconds, depending on server load. The map keeps a two-hour history.
How accurate are lightning maps?
Accuracy depends on the network and the area. Professional networks such as Vaisala’s NLDN in the US detect over 95% of cloud-to-ground flashes with median location accuracy better than 150 metres. Community networks like Blitzortung are most accurate where many detectors surround the storm and less accurate where detectors are sparse; the map’s coverage layer shows how well your area is covered.
Is there such a thing as a lightning radar?
Not really. Weather radar detects rain, hail and snow, not lightning. What people call a lightning radar or lightning tracker is a map of strikes located by radio detectors or satellites. Using a rain radar and a lightning map together gives the fullest picture of a storm.
How can I tell how far away lightning is?
Count the seconds between the flash and the thunder. Divide by 5 for the distance in miles, or by 3 for kilometres. If you can hear thunder at all, the lightning is within about 10 miles, which is close enough to strike you.
How do I know which way a storm is moving on a lightning map?
Follow the colours from oldest to newest. The line from the yellow strikes (20–40 minutes old) to the white strikes (under 20 minutes) shows the direction of travel. Measure the gap with the scale bar and multiply by three to estimate the speed per hour.
Can I rely on a lightning map for safety?
No. A lightning map has a short delay and can miss strikes, and the Blitzortung map itself says not to use its data to protect people or equipment. Follow NOAA’s rule: when thunder roars, go indoors, and wait 30 minutes after the last thunder before going back outside.
Sources
- Blitzortung.org live lightning map: legend, layer descriptions and disclaimer
- Blitzortung.org: how the network detects and locates lightning
- NOAA JetStream: Lightning safety
- National Weather Service: Thunder and how to estimate distance
- National Weather Service: Lightning myths and facts
- National Weather Service: Lightning safety and fatality statistics
- Vaisala: National Lightning Detection Network (NLDN)
- Atmospheric Measurement Techniques: performance assessment of the World Wide Lightning Location Network
- NASA: Geostationary Lightning Mapper overview
- NOAA NESDIS: Geostationary Lightning Mapper
- EUMETSAT: Lightning Imager data debut
- NASA: Global frequency and distribution of lightning as observed from space
- NOAA: The intracloud lightning fraction in the contiguous United States
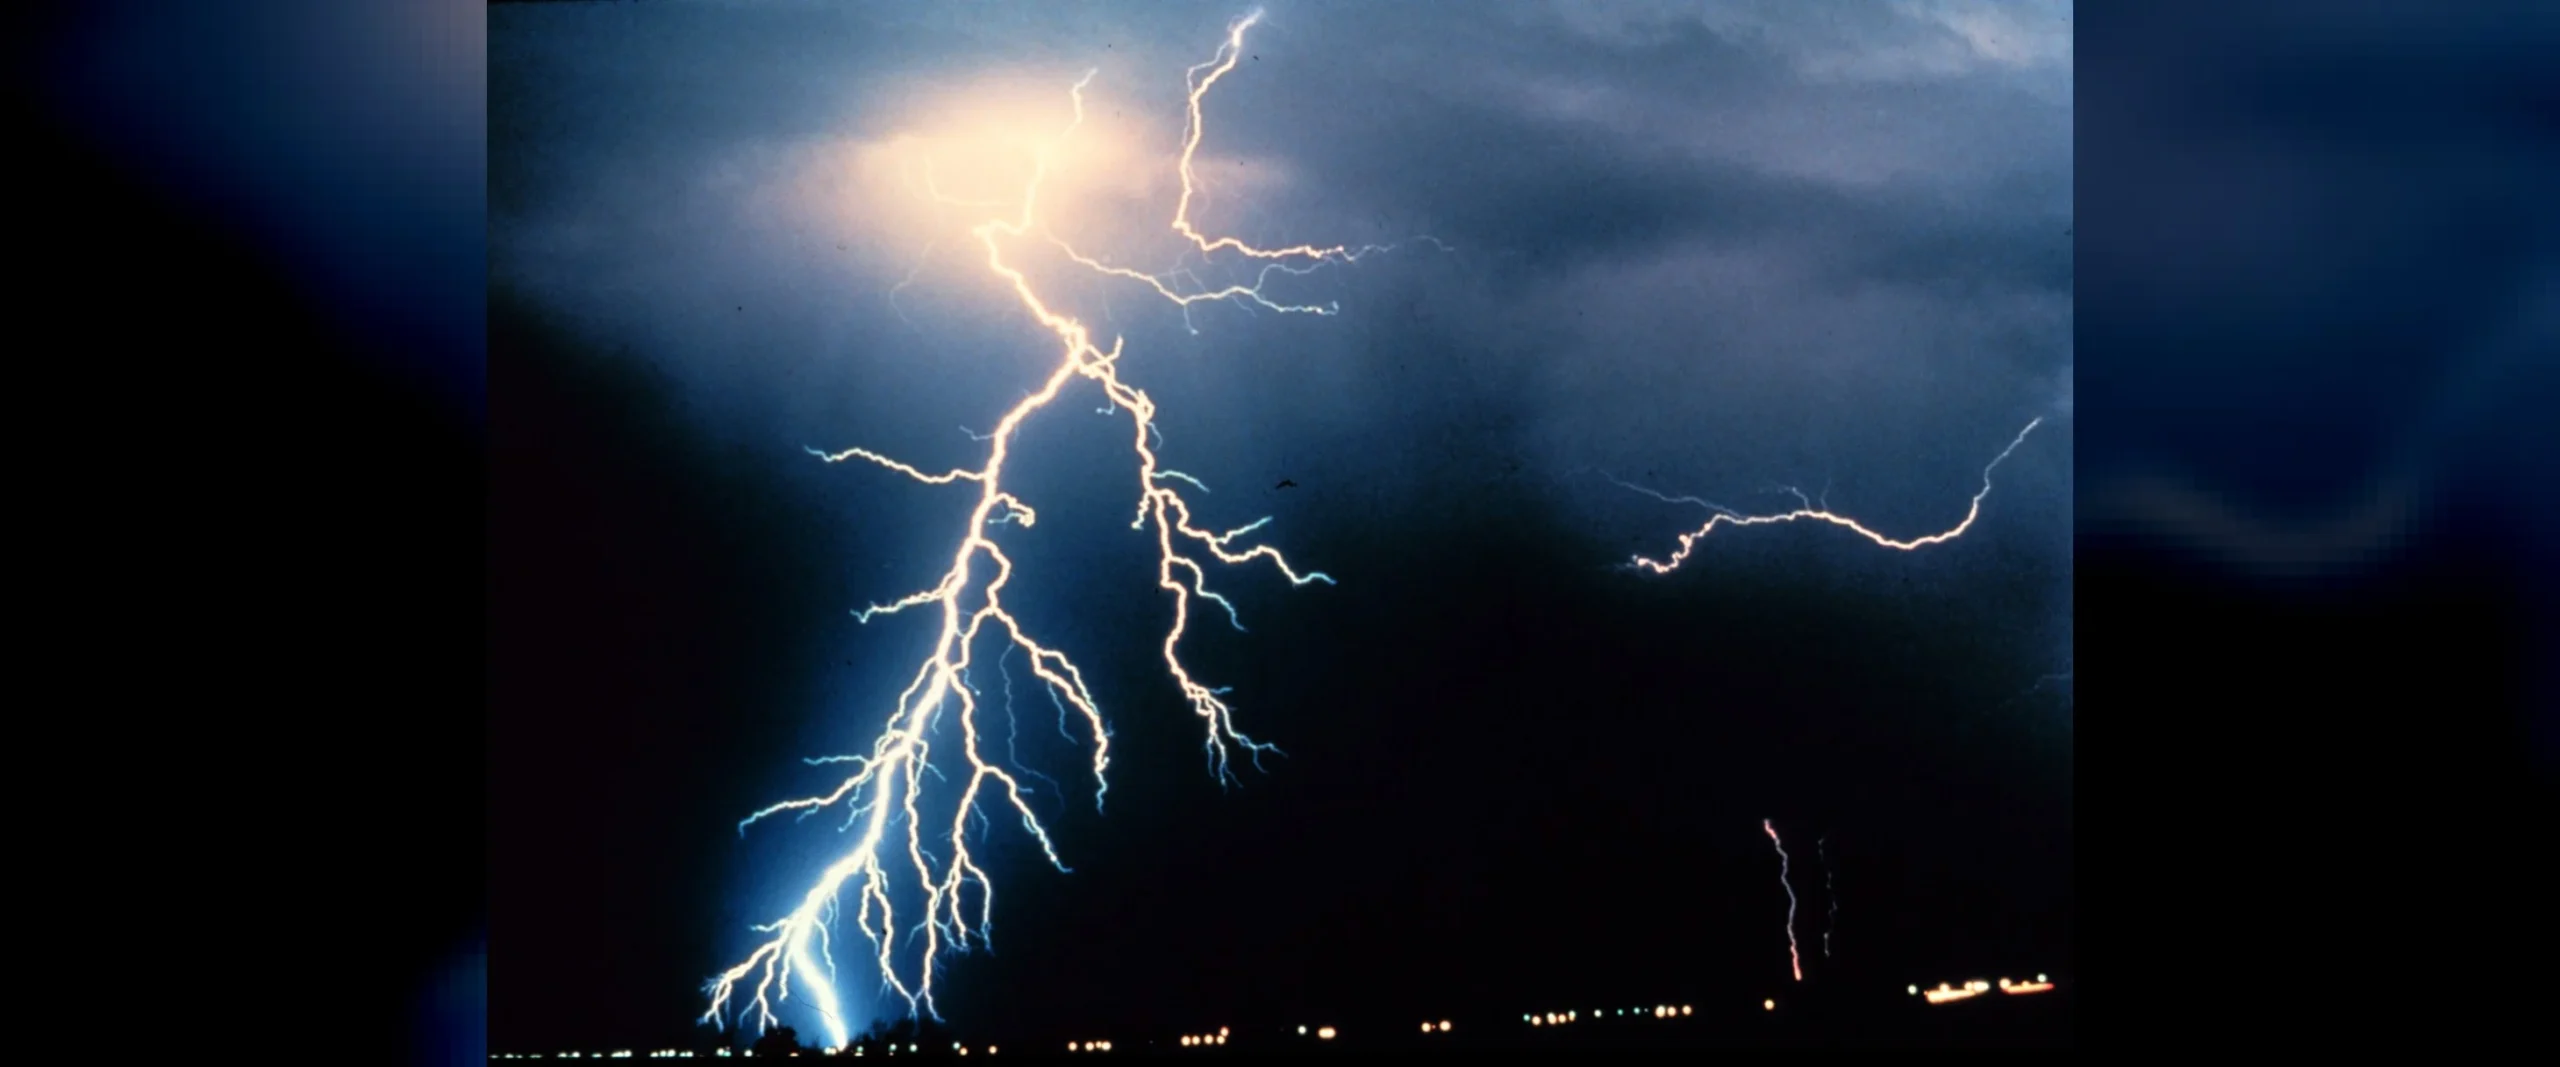
- NOAA Photo Library: National Severe Storms Laboratory lightning collection (featured image)