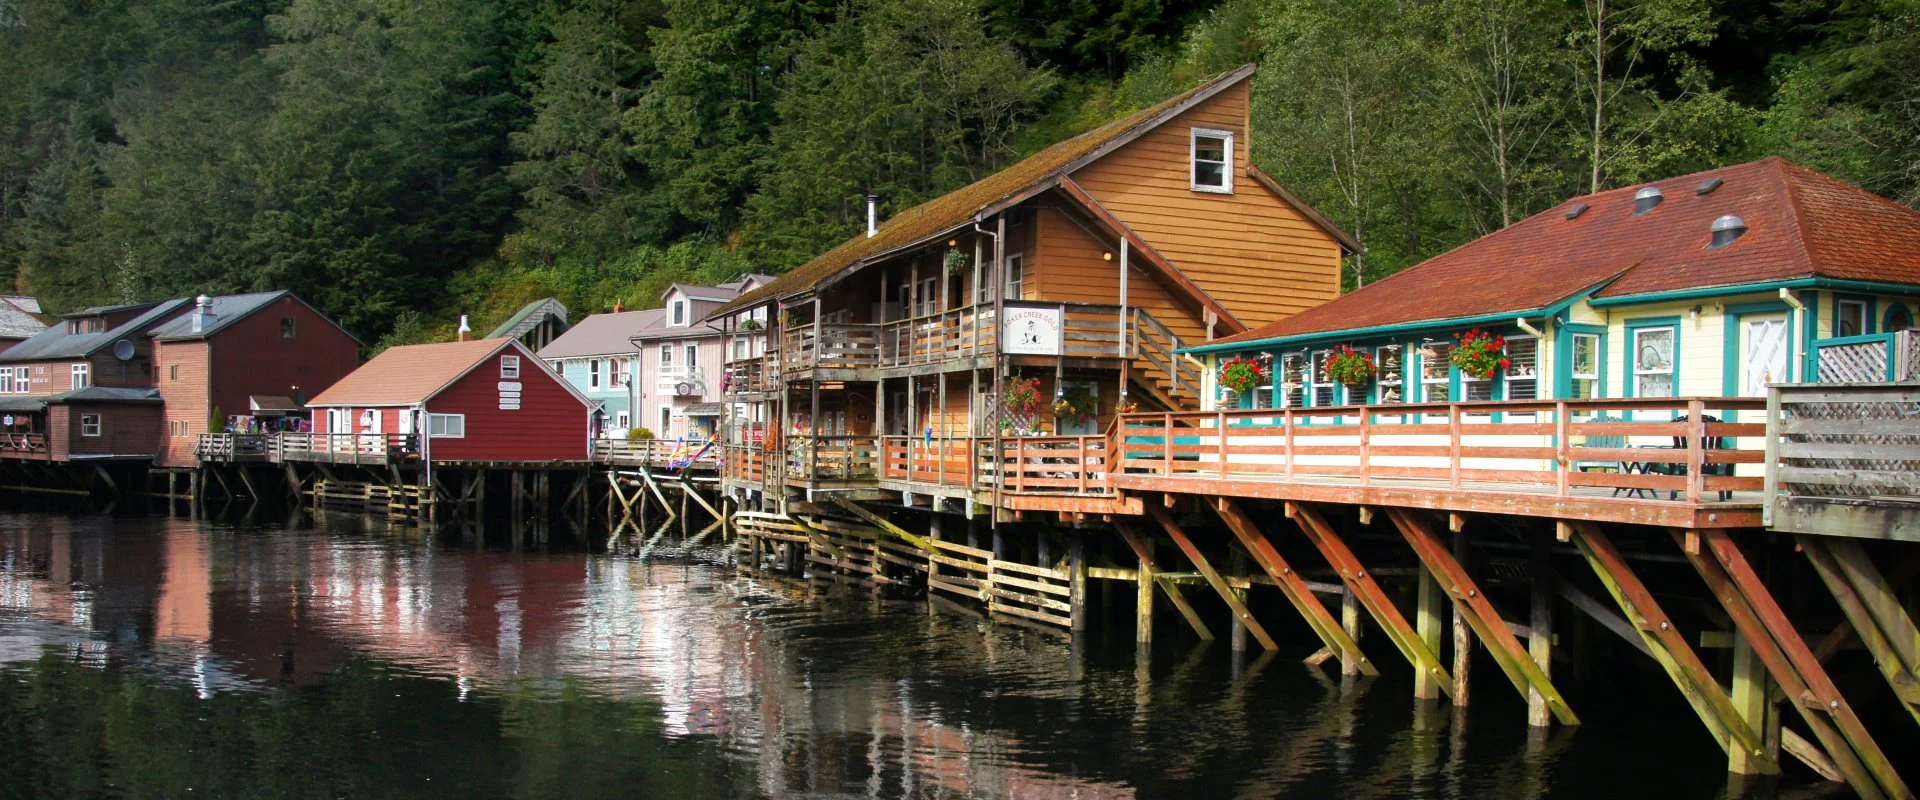
The rainiest city in the US is Ketchikan, Alaska, with 149.5 inches (3,798 mm) of rain a year, according to NOAA’s official 1991-2020 climate normals. In the lower 48 states, the rainiest city is Pensacola, Florida, at 68.3 inches, just ahead of Miami and Mobile. Seattle, despite its reputation, gets 39.3 inches and ranks 42nd of the 76 cities we compared.
We pulled the official 30-year averages from the National Oceanic and Atmospheric Administration (NOAA) for 76 US cities: the 50 largest plus 26 others, including the wettest and driest places that have a main weather station. Then we ranked them by total precipitation, by rainy days and by heavy-rain days.
Below you will find the top 20, the cities with the most rainy days, why Seattle is not number one, the rainiest state and the driest cities.
Rainiest Cities in the US: Key Facts
- Rainiest city: Ketchikan, Alaska, 149.5 in (3,798 mm) a year.
- Rainiest in the lower 48: Pensacola, Florida, 68.3 in, ahead of Miami (67.4 in) and Mobile (67.1 in).
- Most rainy days: Hilo, Hawaii, 273 days a year with measurable rain.
- Seattle: 39.3 in, 42nd of 76, less than New York or Boston, but on 156 days.
- Heaviest downpours: Gulf Coast and Florida cities get 37-41 days a year with half an inch or more.
- Driest city: Yuma, Arizona, 3.3 in a year; Las Vegas gets 4.2 in.
- Rainiest state: Louisiana in the lower 48 (59.7 in a year); Hawaii overall (61.7 in).
The 20 Rainiest Cities in the US
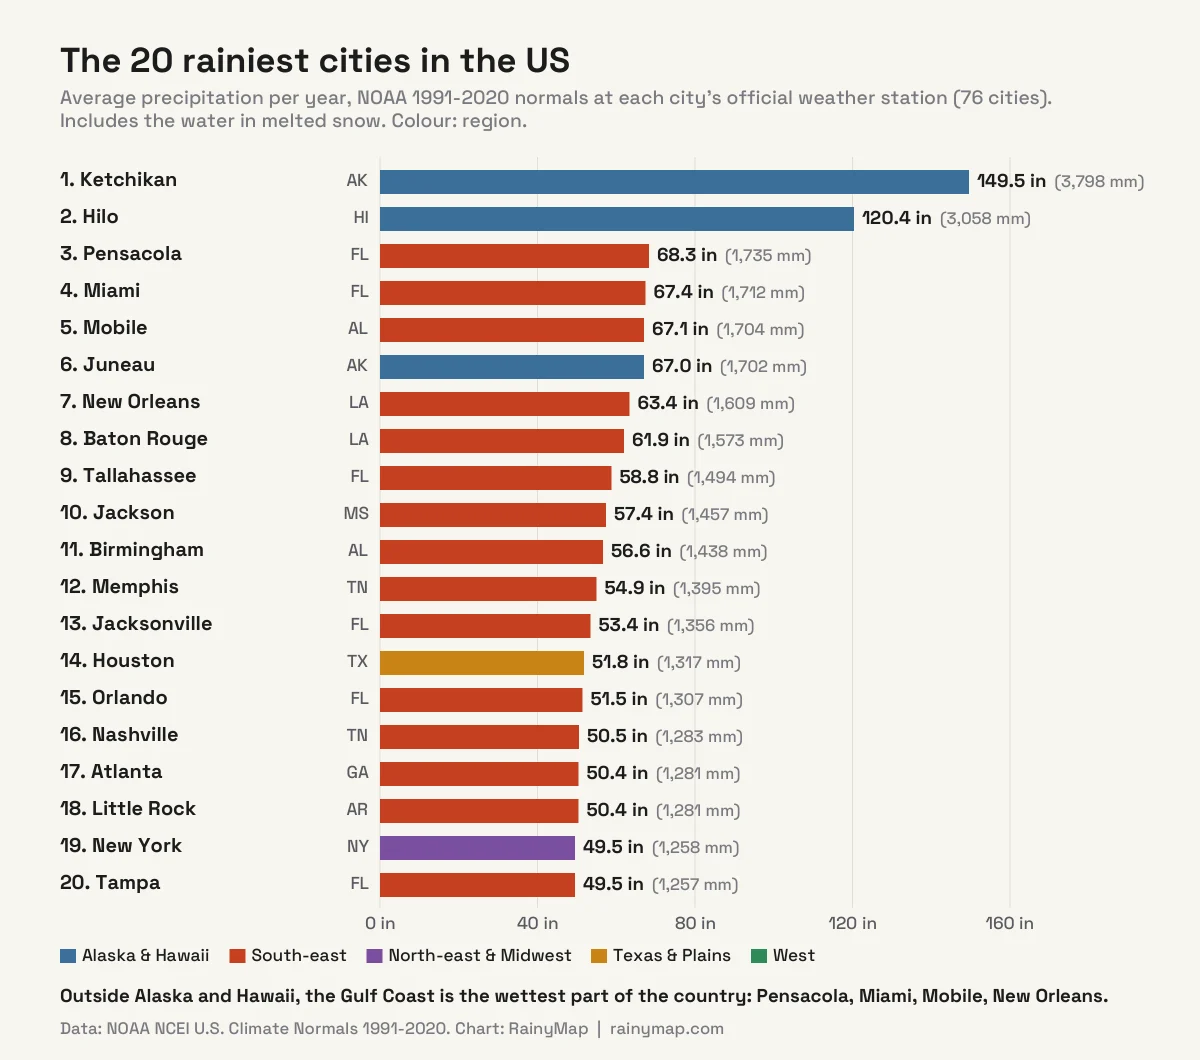
This ranking uses NOAA’s U.S. Climate Normals for 1991-2020, the official 30-year averages for each city’s main National Weather Service station, usually its largest airport. The totals include the water in melted snow.
| # | City | Rain per year | Rainy days* | Wettest month |
|---|---|---|---|---|
| 1 | Ketchikan, AK | 149.5 in (3,798 mm) | 233 | October (18.4 in) |
| 2 | Hilo, HI | 120.4 in (3,058 mm) | 273 | November (14.4 in) |
| 3 | Pensacola, FL | 68.3 in (1,735 mm) | 115 | July (7.9 in) |
| 4 | Miami, FL | 67.4 in (1,712 mm) | 141 | June (10.5 in) |
| 5 | Mobile, AL | 67.1 in (1,704 mm) | 117 | July (7.7 in) |
| 6 | Juneau, AK | 67.0 in (1,702 mm) | 230 | September (9.2 in) |
| 7 | New Orleans, LA | 63.4 in (1,609 mm) | 115 | June (7.6 in) |
| 8 | Baton Rouge, LA | 61.9 in (1,573 mm) | 114 | June (6.5 in) |
| 9 | Tallahassee, FL | 58.8 in (1,494 mm) | 114 | June (7.8 in) |
| 10 | Jackson, MS | 57.4 in (1,457 mm) | 111 | April (5.8 in) |
| 11 | Birmingham, AL | 56.6 in (1,438 mm) | 118 | March (5.7 in) |
| 12 | Memphis, TN | 54.9 in (1,395 mm) | 111 | April (5.9 in) |
| 13 | Jacksonville, FL | 53.4 in (1,356 mm) | 114 | June (7.6 in) |
| 14 | Houston, TX | 51.8 in (1,317 mm) | 104 | June (6.0 in) |
| 15 | Orlando, FL | 51.5 in (1,307 mm) | 121 | June (8.1 in) |
| 16 | Nashville, TN | 50.5 in (1,283 mm) | 123 | May (5.0 in) |
| 17 | Atlanta, GA | 50.4 in (1,281 mm) | 116 | July (4.8 in) |
| 18 | Little Rock, AR | 50.4 in (1,281 mm) | 106 | April (5.6 in) |
| 19 | New York, NY | 49.5 in (1,258 mm) | 125 | July (4.6 in) |
| 20 | Tampa, FL | 49.5 in (1,257 mm) | 108 | August (9.0 in) |
Apart from Alaska and Hawaii, the list is dominated by the South-east. Fifteen of the top 20 are in Florida, Louisiana, Alabama, Mississippi, Tennessee, Georgia or Arkansas. New York, at 49.5 inches, is the only north-eastern city in the top 20; our guide to the best time to visit New York shows how that rain spreads through the year.
What Is the Rainiest City in the Mainland US?
Pensacola, on the western tip of the Florida Panhandle, with 68.3 inches a year. Its lead is tiny: Miami gets 67.4 inches and Mobile, Alabama 67.1 inches, a difference smaller than one heavy afternoon storm. New Orleans (63.4 in) and Baton Rouge (61.9 in) complete the Gulf Coast cluster.
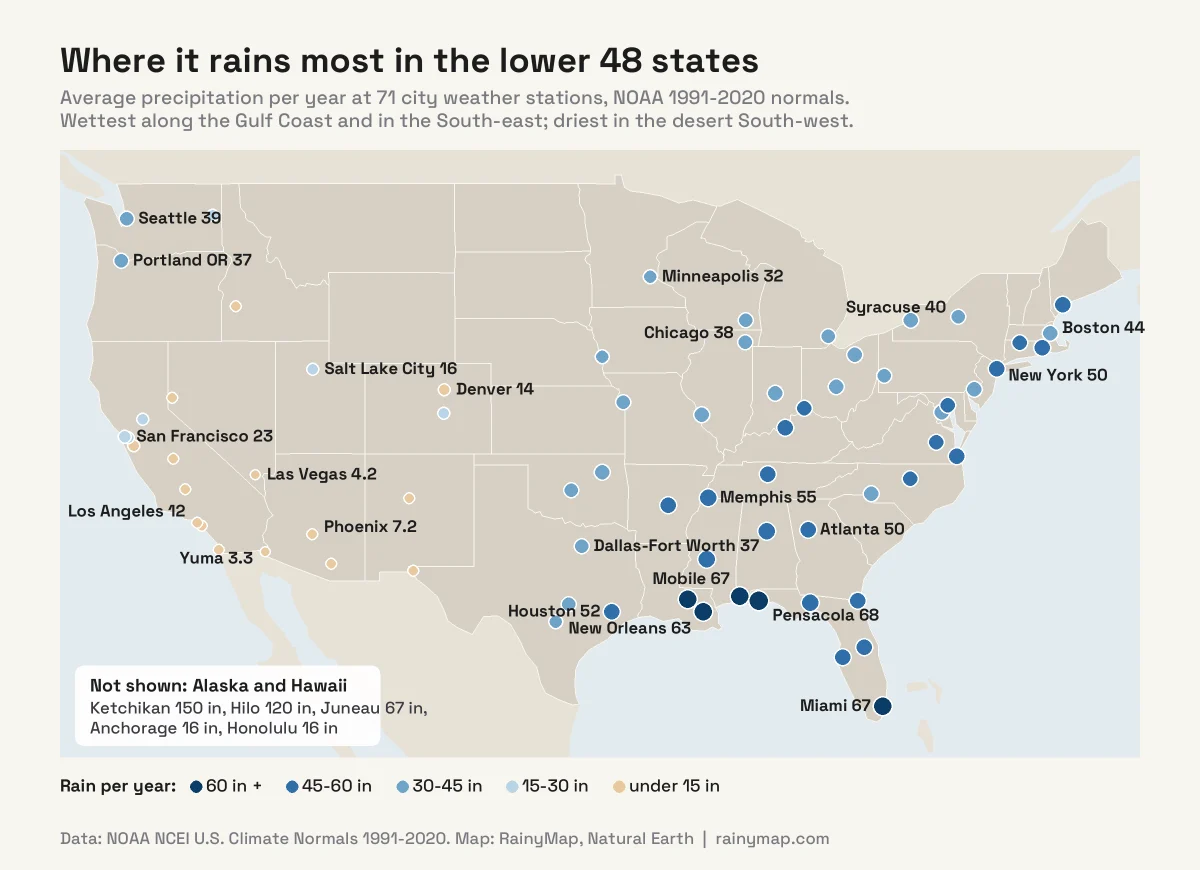
The Gulf of Mexico supplies a constant stream of warm, humid air. Southerly winds push it inland, where summer heating sets off almost daily thunderstorms, and cold fronts and tropical storms wring it out the rest of the year. A Louisiana climate summary from the North Carolina Institute for Climate Studies notes yearly totals ranging from about 50 inches in the north of the state to about 70 inches in parts of the south-east, and more than 60 days a year with thunderstorms.
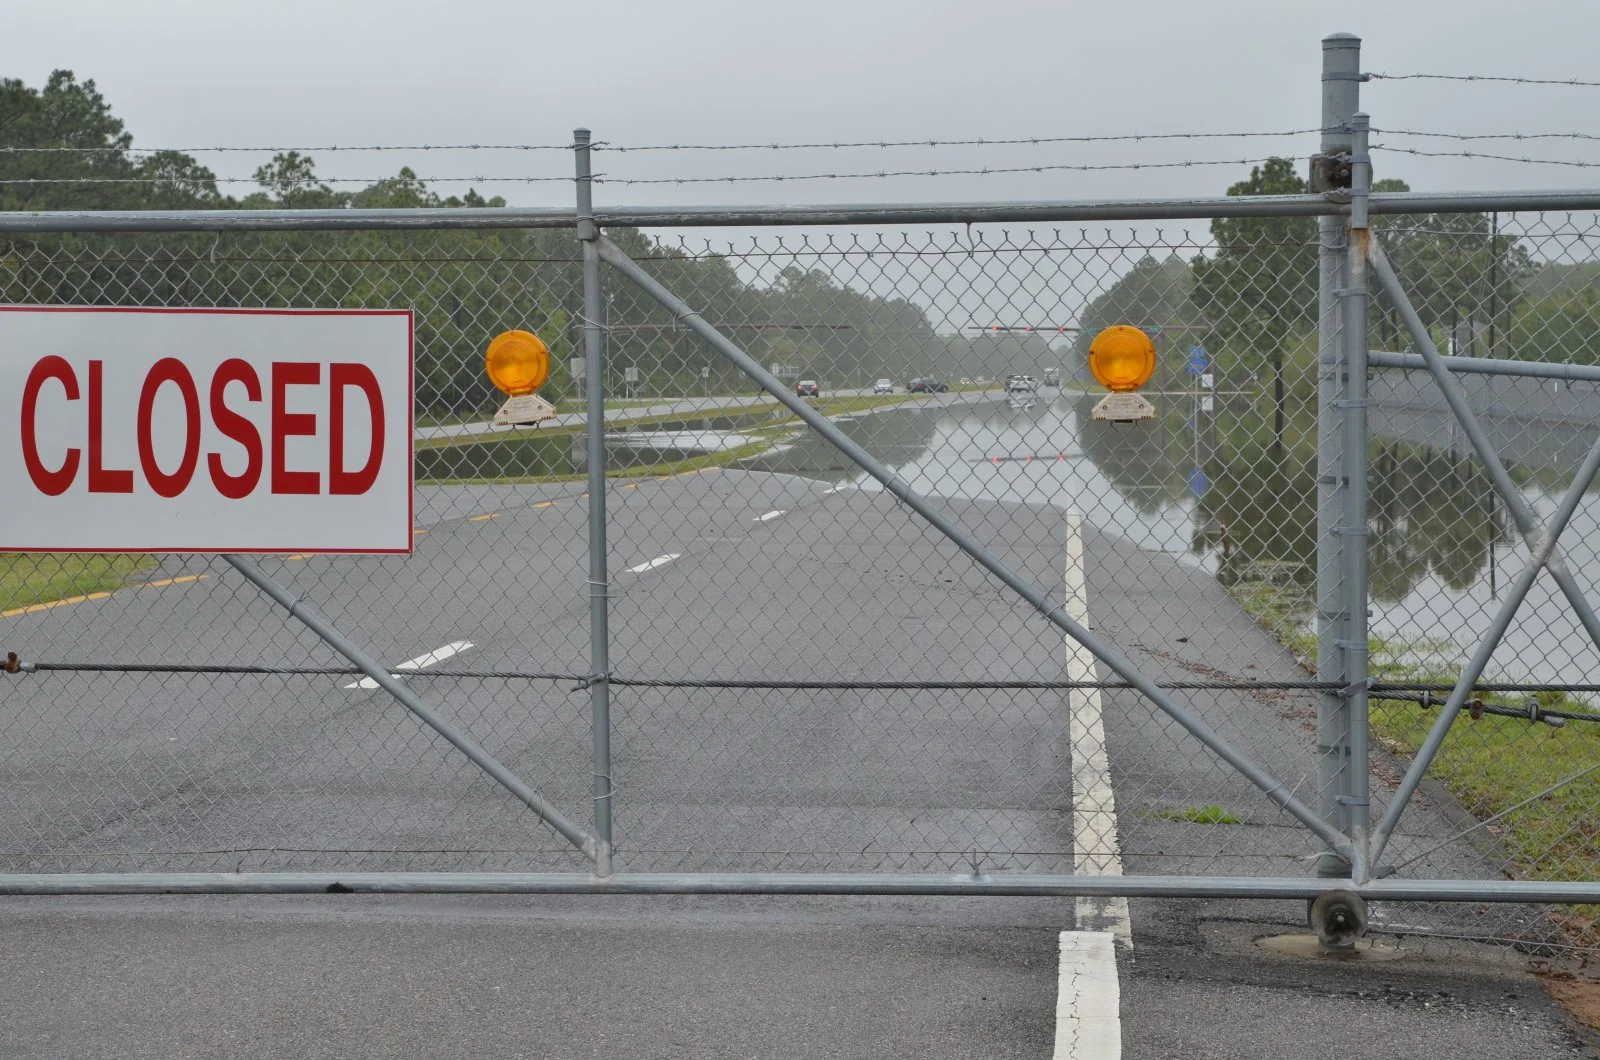
Gulf Coast rain also comes in big doses. Pensacola, Mobile and Miami each average around 40 days a year with at least half an inch (13 mm) of rain, more than any other mainland city in our list. Pensacola’s wettest month, July, averages 7.9 inches, about what Las Vegas gets in two years. Our guide to flash flood safety explains what to do when those downpours hit.
Which US Cities Have the Most Rainy Days?
Total rainfall is only half the story. For most people, what matters is how often it rains. Here are the cities with the most days of at least 0.10 inch (2.5 mm), enough to notice, and of any measurable precipitation.
| # | City | Days with 0.10 in or more | Days with any (0.01 in+) | Rain per year |
|---|---|---|---|---|
| 1 | Hilo, HI | 186 | 273 | 120.4 in |
| 2 | Ketchikan, AK | 177 | 233 | 149.5 in |
| 3 | Juneau, AK | 149 | 230 | 67.0 in |
| 4 | Buffalo, NY | 94 | 166 | 40.7 in |
| 5 | Seattle, WA | 93 | 156 | 39.3 in |
| 6 | Portland, OR | 93 | 157 | 36.9 in |
| 7 | Syracuse, NY | 90 | 174 | 39.9 in |
| 8 | Miami, FL | 90 | 141 | 67.4 in |
| 9 | Cleveland, OH | 89 | 159 | 41.0 in |
| 10 | Pittsburgh, PA | 86 | 154 | 39.6 in |
Alaska and Hawaii top this list too, but the mainland leaders are a surprise: Buffalo, Seattle, Portland (Oregon) and Syracuse, with Miami and Cleveland close behind. In Buffalo and Syracuse, much of that is snow: Syracuse averages about 128 inches of snowfall a year, the most of any city in our list. The Gulf Coast cities, despite their huge totals, have fewer wet days, because their rain falls in short, intense bursts.
Is Seattle the Rainiest City in the US?
No, not even close. Seattle gets 39.3 inches a year at Sea-Tac Airport, less than New York (49.5 in), Boston (43.6 in), Houston (51.8 in) or Atlanta (50.4 in). It ranks 42nd of the 76 cities we compared.
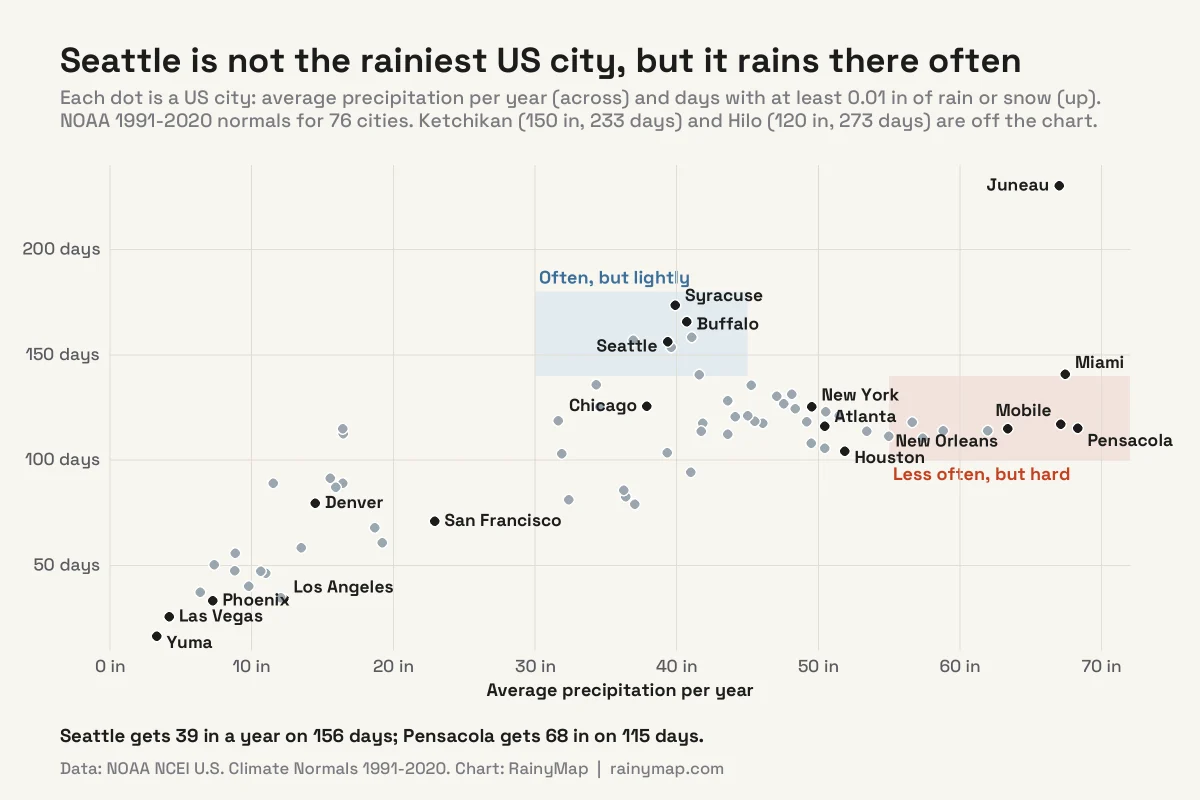
Seattle’s reputation comes from frequency and timing. It records measurable precipitation on about 156 days a year, and 93 days with at least 0.10 inch, among the most of any big city in the lower 48. And it is concentrated in the dark half of the year: 75% of Seattle’s precipitation falls between October and March, much of it as long spells of light rain and drizzle under low cloud. Grey skies add to the impression: NOAA’s comparative climate data count about 226 cloudy days a year at Sea-Tac, against 132 in New York and 137 in Pensacola.
Summer is the opposite. July averages just 0.6 inches in Seattle, less than in Phoenix.
What Is the Rainiest State in the US?
Hawaii, if you count the islands. In NOAA’s statewide data, Hawaii averaged about 61.7 inches a year over 1991-2020. In the lower 48, the wettest state is Louisiana, at about 59.7 inches (1,517 mm), and the whole top five sits in the Deep South.
| # | State | Average precipitation per year |
|---|---|---|
| 1 | Hawaii | 61.7 in (1,568 mm) |
| 2 | Louisiana | 59.7 in (1,517 mm) |
| 3 | Mississippi | 58.5 in (1,486 mm) |
| 4 | Alabama | 56.9 in (1,445 mm) |
| 5 | Tennessee | 55.1 in (1,400 mm) |
| 6 | Florida | 54.4 in (1,382 mm) |
| 7 | Arkansas | 52.5 in (1,333 mm) |
| 8 | North Carolina | 50.8 in (1,290 mm) |
| 9 | Kentucky | 50.4 in (1,280 mm) |
| 10 | Georgia | 50.4 in (1,280 mm) |
Washington, the state everyone associates with rain, averages about 43.2 inches: very wet on the Pacific coast and in the Cascades, but dry in the east, where Spokane gets just 16.5 inches. At the other end, Nevada is the driest state at about 10.2 inches, followed by Arizona (11.7 in) and Utah (13.5 in).
What Are the Driest Cities in the US?
| # | City | Rain per year | Rainy days* |
|---|---|---|---|
| 1 | Yuma, AZ | 3.3 in (83 mm) | 17 |
| 2 | Las Vegas, NV | 4.2 in (106 mm) | 26 |
| 3 | Bakersfield, CA | 6.4 in (162 mm) | 38 |
| 4 | Phoenix, AZ | 7.2 in (183 mm) | 33 |
| 5 | Reno, NV | 7.3 in (187 mm) | 51 |
| 6 | El Paso, TX | 8.8 in (223 mm) | 48 |
| 7 | Albuquerque, NM | 8.8 in (225 mm) | 56 |
| 8 | San Diego, CA | 9.8 in (249 mm) | 40 |
The driest cities are in the desert South-west, far from moist air and sheltered by mountain ranges to their west. Yuma gets measurable rain on only about 17 days a year. Los Angeles (12.2 in) and San Diego (9.8 in) are dry too, with about 80% of Los Angeles’s rain falling between December and March.
Where Is the Wettest Place in the US?
Not in any city. The wettest spots are on mountain slopes facing the trade winds in Hawaii and the Pacific storms of the Olympic Peninsula.
- Hawaii: Big Bog on Maui averages about 404 inches (10,271 mm) a year, the highest value on the Rainfall Atlas of Hawaiʻi. Kukui, also on Maui, holds the US record for a single year: 704.83 inches in 1982.
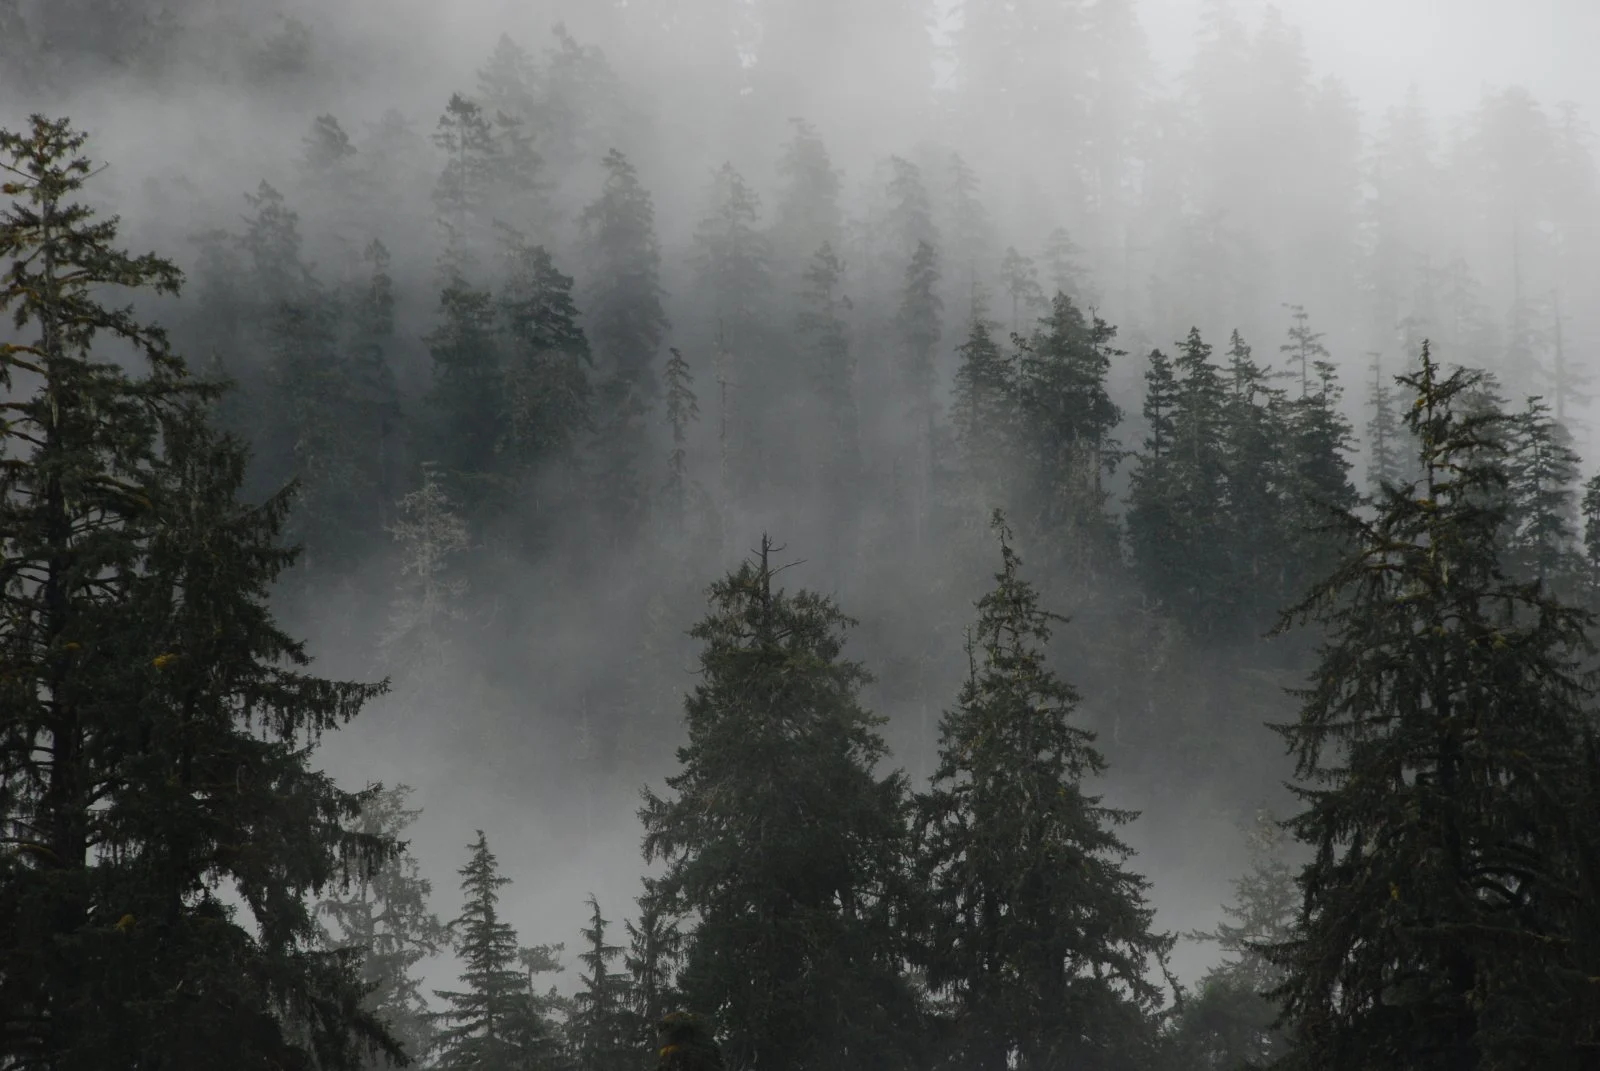
- Lower 48: the temperate rain forests of Olympic National Park, Washington, get 140 to 167 inches a year, according to the National Park Service. The nearest NOAA normals stations are Forks (119.9 in) and Quillayute (101.3 in).
The most rain recorded in 24 hours anywhere in the US is 49.69 inches, at Waipā Garden on Kauaʻi on 14-15 April 2018, according to NOAA’s State Climate Extremes Committee. In the lower 48, the record still belongs to Alvin, Texas, south of Houston, where about 42 inches fell in 24 hours during Tropical Storm Claudette in July 1979. At the dry end, Death Valley recorded no rain at all in 1929, and Bagdad, California went 767 days without measurable rain in 1912-1914.
How We Built This Ranking
- Official data only. Every figure comes from NOAA’s U.S. Climate Normals 1991-2020, downloaded from the NCEI data service on 16 November 2026.
- One station per city. We used each city’s main National Weather Service climate station, usually its main airport (for example Sea-Tac for Seattle, Central Park for New York, Reagan National for Washington, D.C.). Rain can vary a lot within a metro area, especially in hilly cities.
- Precipitation, not just rain. NOAA’s totals include melted snow, sleet and hail, so northern cities get credit for winter snow.
- 76 cities. The 50 largest cities, plus the wettest and driest places with a main weather station: Ketchikan, Juneau, Hilo, Pensacola, Yuma and others.
How to Check the Rain in Your City Right Now
- Open RainyMap’s real-time rain map and tap Use My Location.
- Most US radar data comes from the NEXRAD network; our explainer on NEXRAD radar shows what it can and cannot see.
- Tracking a tropical storm toward the Gulf Coast? Here is how to track a hurricane in real time.
- Read the forecast percentage correctly with our guide to what a chance of rain means.
To see where it is raining across the country and the world at this moment, open where is it raining right now. For the global picture, see our ranking of the rainiest cities in the world, where Ketchikan ranks 10th and Seattle does not make the top 90.
Frequently Asked Questions
What is the rainiest city in the US?
Ketchikan, Alaska. NOAA’s 1991-2020 climate normals give it 149.5 inches (3,798 mm) of precipitation a year, the most of the 76 US cities we compared. Hilo, Hawaii is second with 120.4 inches.
What is the rainiest city in the mainland US?
Pensacola, Florida, with 68.3 inches (1,735 mm) a year, followed very closely by Miami (67.4 in) and Mobile, Alabama (67.1 in). All three sit on the Gulf of Mexico or the Florida coast, where warm, humid air fuels frequent heavy thunderstorms.
Is Seattle the rainiest city in the US?
No. Seattle gets 39.3 inches a year at Sea-Tac Airport, which ranks 42nd of the 76 cities we compared, behind New York (49.5 in), Boston, Houston and Atlanta. Seattle’s reputation comes from how often it rains: about 156 days a year with measurable precipitation, mostly light rain between October and March.
Which US city has the most rainy days?
Hilo, Hawaii, with about 273 days a year with measurable precipitation, followed by Ketchikan (233) and Juneau (230). In the lower 48, Syracuse (174) and Buffalo (166) lead, partly because of lake-effect snow; Seattle has 156.
What is the rainiest state in the US?
Hawaii, with a statewide average of about 61.7 inches a year over 1991-2020 in NOAA’s Climate at a Glance data. In the lower 48, Louisiana is the wettest at about 59.7 inches, followed by Mississippi (58.5 in) and Alabama (56.9 in). Nevada is the driest state, at about 10.2 inches.
What is the driest city in the US?
Of the 76 cities we compared, Yuma, Arizona, with 3.3 inches a year, followed by Las Vegas (4.2 in), Bakersfield, California (6.4 in) and Phoenix (7.2 in). Outside the cities, the driest place in the US is Death Valley, California, where NOAA’s 1991-2020 normal is 2.2 inches a year and no rain at all fell in 1929.
Which month is the rainiest in the US?
It depends on the region. Gulf Coast and Florida cities get most of their rain in summer thunderstorms, peaking in June to August; Miami gets about two-thirds of its rain from June to October. The Pacific Northwest and California are the opposite: Seattle gets 75% of its rain from October to March, and Los Angeles 80% from December to March.
Does the precipitation total include snow?
Yes. NOAA’s precipitation normals count the water content of melted snow and ice as well as rain. That is why snowy cities such as Syracuse (about 128 inches of snowfall a year) and Buffalo score high on precipitation days.
Where does it rain the most in the US?
In Hawaii. The wettest spot on the Rainfall Atlas of Hawaiʻi is Big Bog on Maui, at about 404 inches a year, and Kukui, Maui recorded the US record for a single year: 704.83 inches in 1982. In the lower 48, the rain forests of Olympic National Park in Washington get 140 to 167 inches a year, according to the National Park Service.
Sources
Data checked on 16 November 2026. City figures are NOAA NCEI U.S. Climate Normals 1991-2020 for each city’s main weather station; the rankings, charts and analysis are RainyMap’s own.
- NOAA NCEI: U.S. Climate Normals 1991-2020 (all city figures)
- NOAA NCEI Climate at a Glance: statewide annual precipitation (Louisiana shown; RainyMap averaged 1991-2020)
- NOAA State Climate Extremes Committee: national records
- National Weather Service Lake Charles: Tropical Storm Claudette, July 1979
- NCICS State Climate Summaries: Louisiana
- NOAA Comparative Climatic Data: cloudy and clear days
- National Park Service: Olympic National Park temperate rain forests
- National Park Service: Death Valley weather and climate
- Rainfall Atlas of Hawaiʻi (University of Hawaiʻi)
Featured image: Creek Street in Ketchikan, Alaska, the rainiest city in the US. Photo: Bernard Spragg / Wikimedia Commons (public domain).