Last updated: 29 September 2026. Data: NOAA Climate Prediction Center (weekly Niño indices to the week of 23 September; ENSO discussion of 10 September 2026) and the IRI forecast of 21 September, plus national weather services.
Quick Answer
The 2026 El Niño is on course to become the strongest ever measured. In the week of 23 September, the sea surface in the central Pacific’s Niño 3.4 region ran 3.1°C above normal. That is the highest weekly reading in NOAA’s record, which starts in 1981, and it arrived about two months earlier in the season than the previous high of +3.0°C in November 2015. NOAA gives a greater than 90% chance of a very strong El Niño this autumn and winter, and a 75% chance that October–December 2026 beats every El Niño since 1950. For winter 2026–27 that tilts the odds toward a wetter, stormier southern United States and California, a milder northern US and Canada, a wet and stormy autumn in the UK and north-west Europe, heavy rain on the coast of Peru and Ecuador, and drought and fire across Indonesia, southern Africa and eastern Australia. Because global temperatures lag El Niño by a few months, 2027 is now widely expected to be the hottest year on record.
The Numbers
- Niño 3.4 (central Pacific), week of 23 September: +3.1°C, the highest weekly value in NOAA’s record. The 2015–16 peak was +3.0°C on 18 November 2015.
- Niño 1+2 (off Peru and Ecuador): +4.7°C, above the 1982–83 peak of +4.5°C and the 1997–98 peak of +4.0°C.
- Niño 3 (eastern Pacific): +3.9°C, also a weekly record.
- June–August Oceanic Niño Index (ONI): +1.80°C, the highest for that season since records began in 1950 (1997: +1.48°C; 2015: +1.44°C).
- NOAA’s official strength index (RONI), June–August: +1.36°C. The record is +2.40°C, set in 1982–83.
- NOAA’s odds: above 90% for a very strong event this autumn and winter; 75% for a “historic” one (RONI of +2.5°C or more) in October–December.
- IRI’s odds: El Niño 100% likely through February 2027, 90% in April–June 2027, and 61% in May–July 2027.
- Models: all 22 models tracked by IRI keep the event very strong through the winter, and nearly all dynamical models put Niño 3.4 above +3.0°C from autumn into winter.
Three Records Already Broken
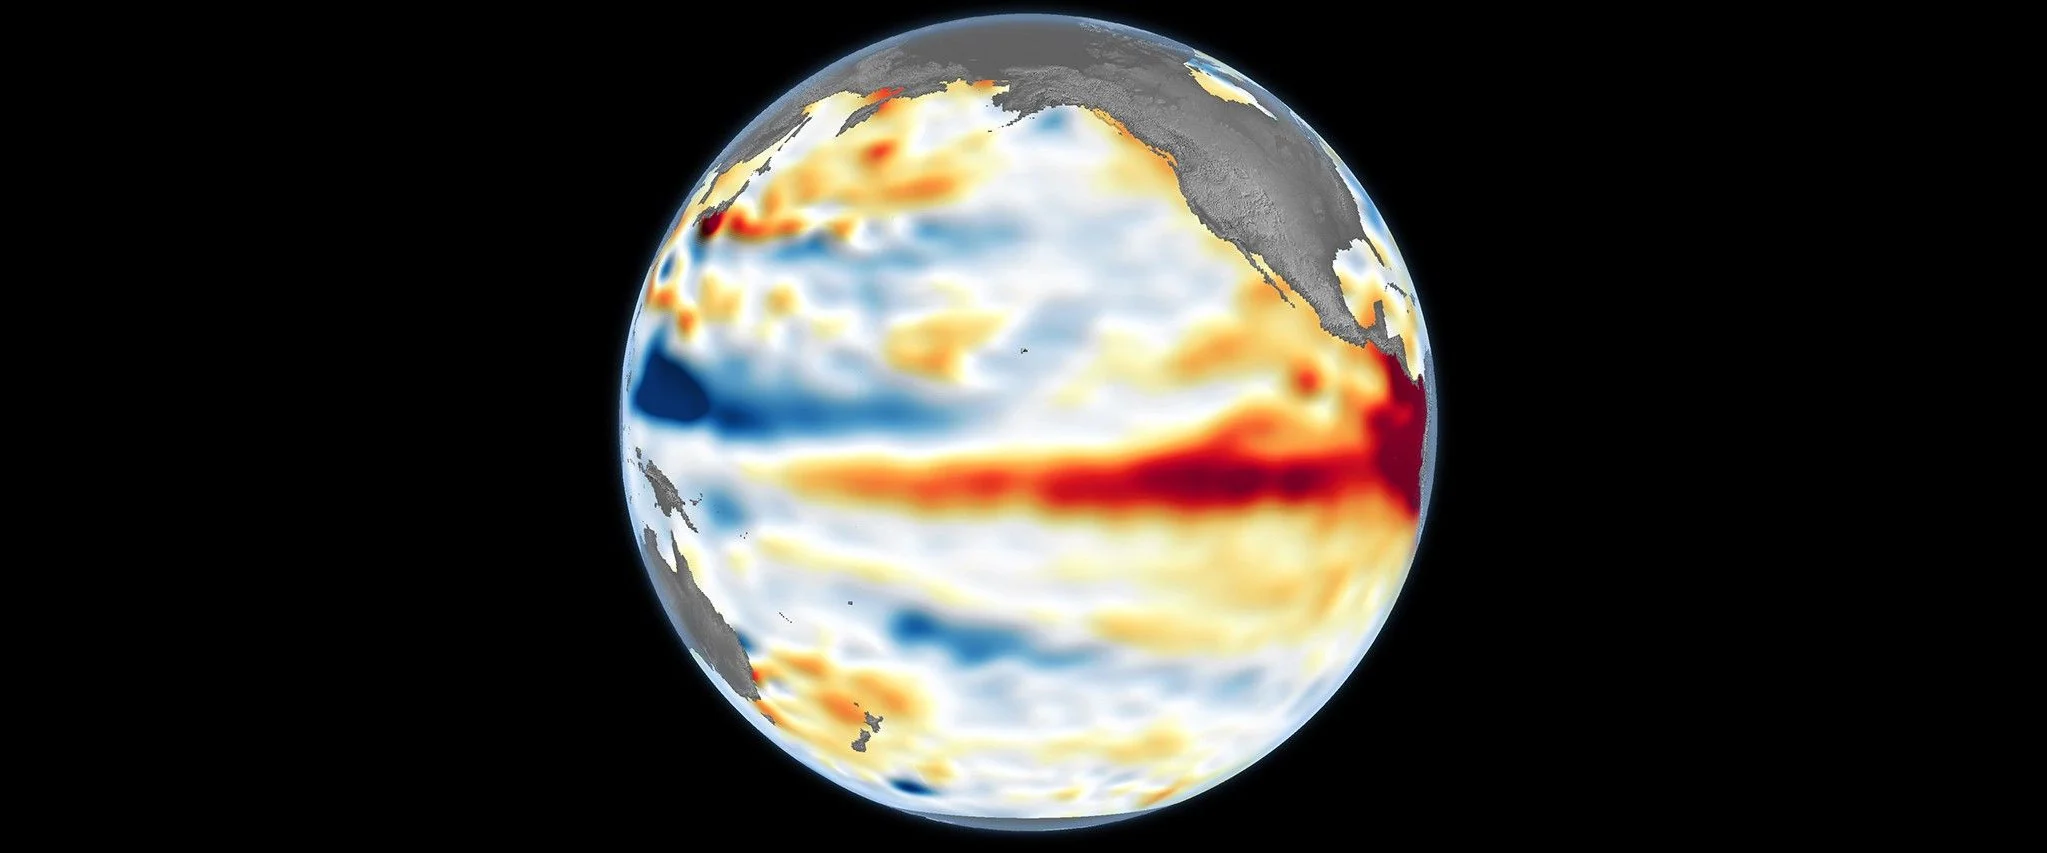
El Niño is measured by how much warmer than normal the surface of the tropical Pacific is. The main yardstick is the Niño 3.4 region, a box straddling the equator between 170°W and 120°W. Scientists also watch Niño 1+2, a smaller box hugging the coast of Peru and Ecuador, and Niño 3 in between. In late September 2026, all three were at levels never seen before in NOAA’s weekly record.
1. The highest weekly reading ever, two months early
The chart below follows the weekly Niño 3.4 reading from January of each great El Niño year. The 2026 line (red) pulled ahead of every other event at the start of June and never looked back. It passed +3.0°C in mid-September, a level that 2015–16 only touched at its very peak in the middle of November, and no other event reached at all.
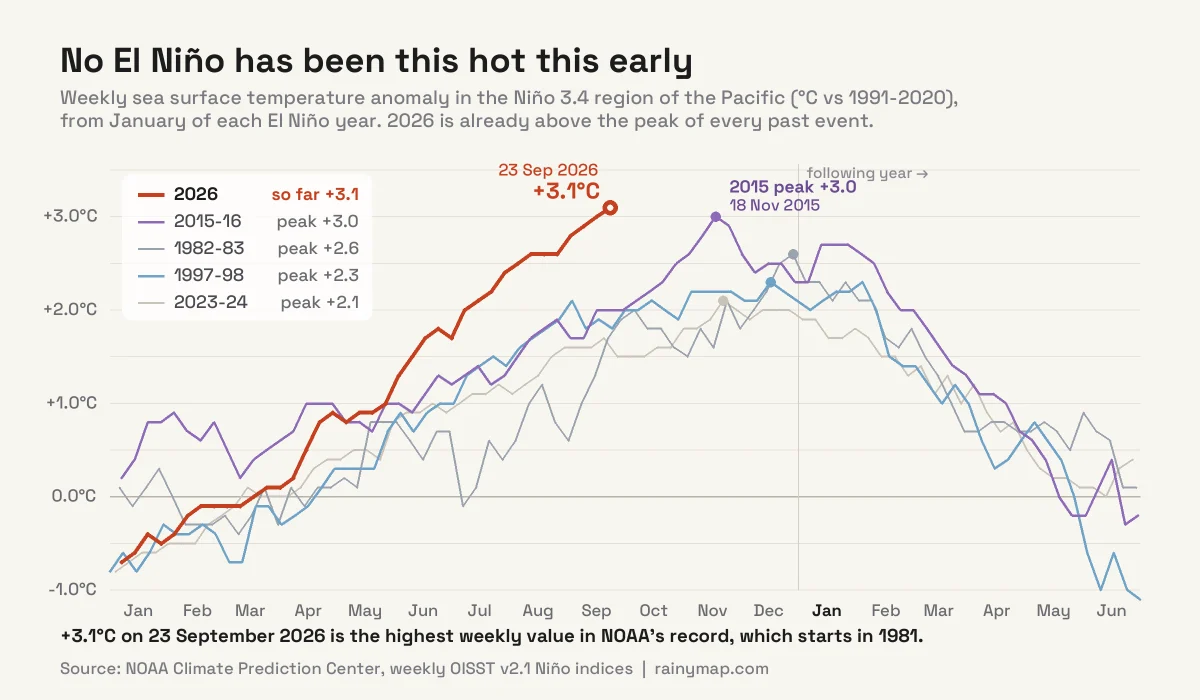
Timing matters as much as the number. El Niño events normally peak between November and January. An event that is already at a record in September still has two or three months of its usual growing season ahead of it.
2. The strongest start of any El Niño since 1950
NOAA’s three-month Oceanic Niño Index reached +1.80°C for June–August 2026. No El Niño since 1950 has been this strong at that point in the year. The runners-up, 1997 and 2015, were at +1.48°C and +1.44°C, and both went on to become two of the three strongest events on record.
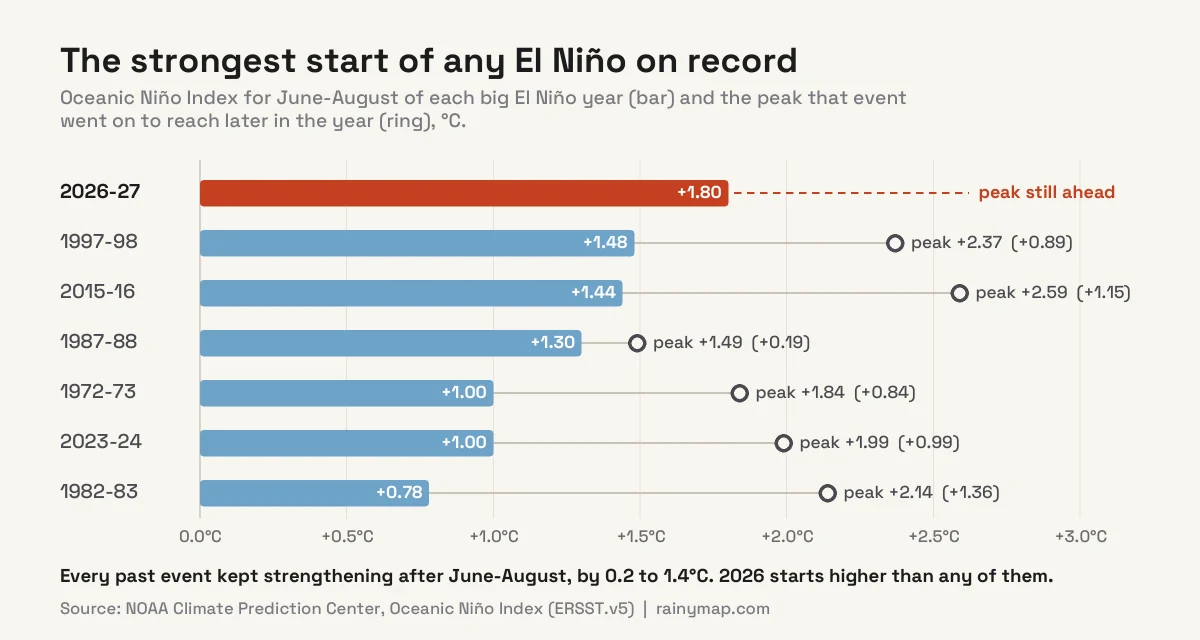
The chart also shows something useful for anyone trying to guess where this goes next. Every one of these events kept strengthening after June–August, by between 0.2°C (1987) and 1.4°C (1982). On average they added about 0.9°C. As a simple rule of thumb, not a forecast, that would take 2026 to roughly +2.7°C on this index, above the +2.59°C peak of 2015–16. Even the weakest growth on record would leave it around +2.0°C, still among the five strongest El Niños on this index.
3. Record warmth off Peru and Ecuador
The most extreme warmth is not in the central Pacific at all. In the Niño 1+2 region along the South American coast, the sea surface was 4.7°C above normal in the week of 23 September, beating the 1982–83 peak of +4.5°C. This is the warmth that fuels torrential rain in the normally desert-dry coastal cities of northern Peru and southern Ecuador.
Is It Officially the Strongest El Niño Ever? Not Yet
Different sources quote different numbers for this El Niño, and it is worth knowing why.
The ocean as a whole is warmer than it used to be. A raw anomaly like the weekly +3.1°C includes some of that background warming. To judge El Niño on its own merits, NOAA now classifies strength with a Relative Oceanic Niño Index (RONI), which subtracts the average warming across the whole tropical ocean. It is also a three-month average, so it responds more slowly than the weekly figures.
On that official scale, the strongest El Niño on record is still 1982–83 at +2.40°C, followed by 1997–98 (+2.28°C) and 2015–16 (+2.25°C). NOAA calls anything from +2.0°C upward “very strong”. An event of +2.5°C or more would exceed every El Niño since 1950; NOAA describes that as a historic event, and gives it a 75% chance for October–December 2026.
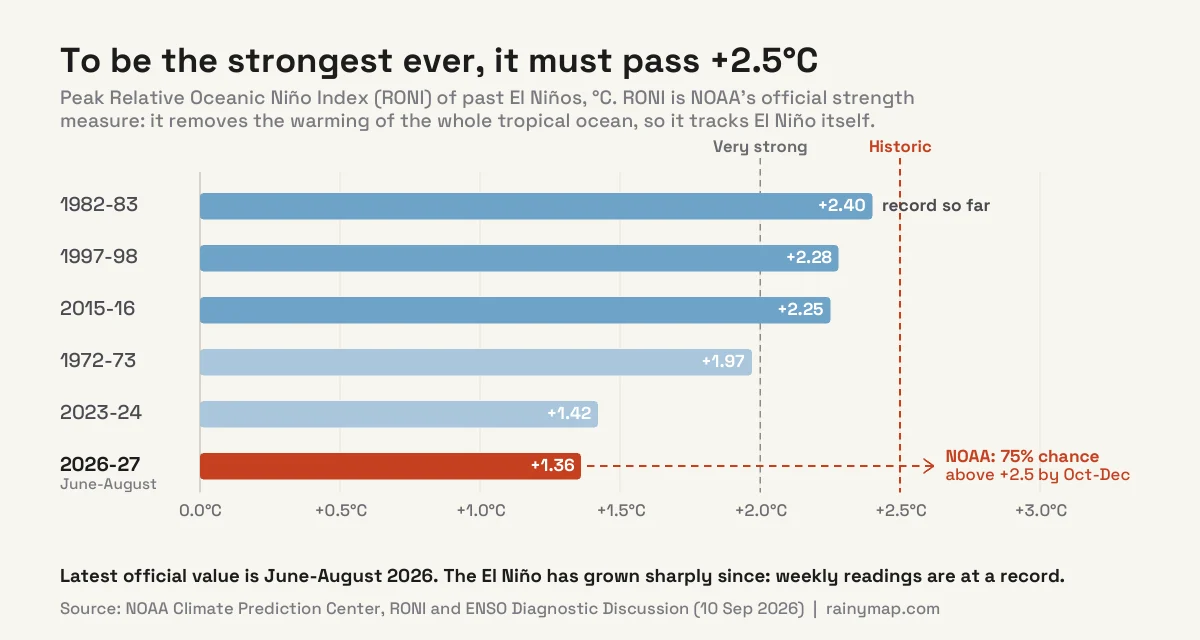
So the honest summary is this: the 2026 El Niño has already set records on the weekly measurements, and is favoured, but not certain, to set the official record by the end of the year. The next NOAA update is due on 8 October.
Why This El Niño Looks Like 1982 and 1997
Where the warmth sits matters as much as how much there is. Here is the pattern across the Pacific in the week of 23 September, from west to east:
| Region | Where it is | Anomaly (23 Sep 2026) | Weekly record? |
|---|---|---|---|
| Niño 4 | Western-central Pacific, near the date line | +1.1°C | No (record +1.7°C, 2015) |
| Niño 3.4 | Central Pacific, 170°W–120°W | +3.1°C | Yes |
| Niño 3 | Eastern Pacific, 150°W–90°W | +3.9°C | Yes |
| Niño 1+2 | Off Peru and Ecuador | +4.7°C | Yes |
The warmth grows steadily toward South America. That is the fingerprint of an eastern Pacific El Niño, the same type as 1982–83 and 1997–98. Those two events delivered some of the most dramatic impacts in the Americas, from flooding in coastal Peru to the storm-battered California winter of 1997–98. The 2015–16 event, by contrast, had more of its warmth further west.
The atmosphere has locked in too. NOAA reports westerly wind anomalies along the equator, deep warmth below the surface with anomalies above +10°C, and a Southern Oscillation Index that remains negative. Rainfall is enhanced over the central and eastern Pacific and suppressed over Indonesia. When ocean and atmosphere reinforce each other like this, an El Niño is hard to stop.
What a Record El Niño Means for Your Winter, Region by Region
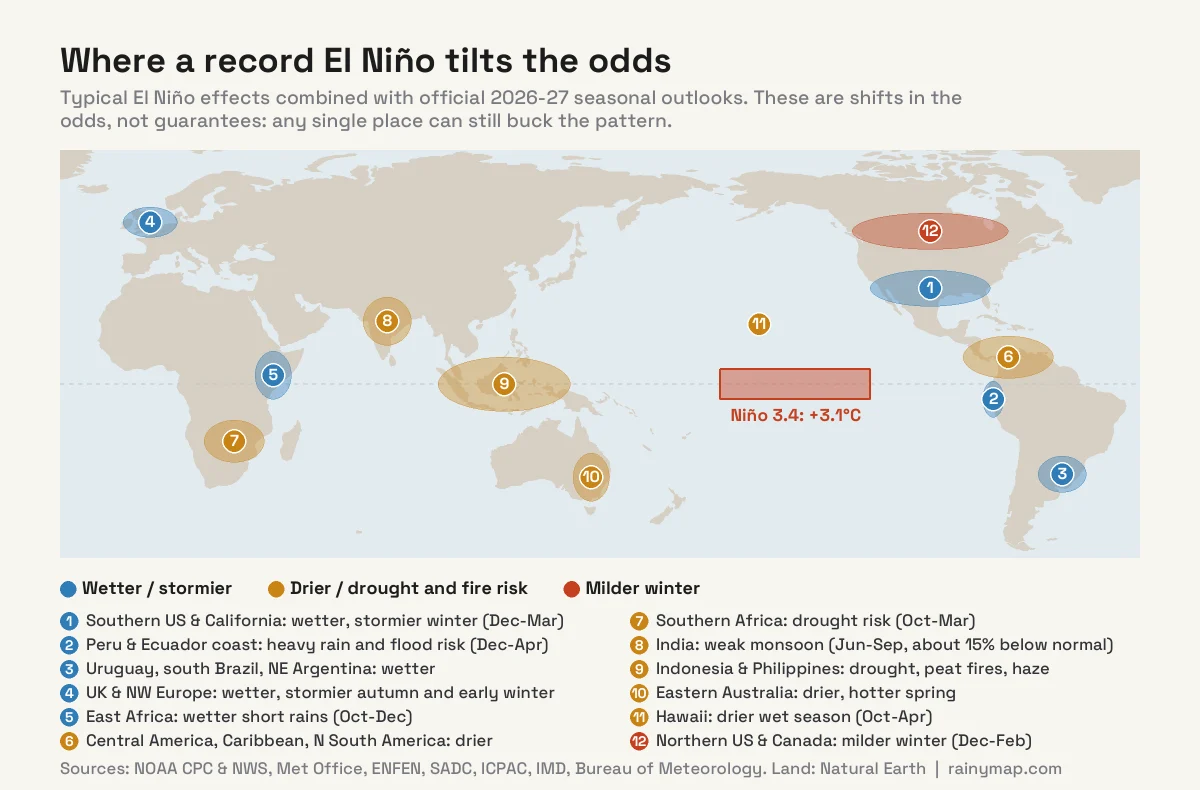
El Niño does not decide the weather anywhere. It shifts the odds, by pushing the jet streams and the tropical rain belts into different positions. The stronger the El Niño, the stronger that push tends to be. The map shows where the shift is expected, combining the typical El Niño pattern with the official 2026–27 seasonal outlooks.
United States: wet and stormy south, mild north
The US signal is the most reliable of all, and it is strongest from December to March. In NOAA’s words, El Niño brings “a strong and amplified Pacific jet stream extending across the southern US”, with the northern polar jet stream pushed up into Canada. That favours:
- Wetter, stormier weather across the southern tier, from California and the Desert Southwest along the Gulf Coast to Florida and the Southeast. Where it is cold enough, that can mean more snow.
- A milder, often drier winter across the north, from the Pacific Northwest and northern Rockies through the northern Plains and the Midwest.
California is the big question. The 1982–83 and 1997–98 events brought exceptionally wet winters. But 2015–16 is the cautionary tale: despite a very strong El Niño and wet forecasts from 9 of 10 seasonal models, coastal Southern California ended up at only 60–68% of its normal rainfall, while the storms went north to the Pacific Northwest. Scientists at Scripps traced that to unusual ocean temperatures in the western Pacific and Indian Ocean. The 2026 event, with its warmth concentrated in the eastern Pacific, looks more like 1997–98 than 2015–16. That is encouraging for rain-hungry Southern California, but a wet winter is still a tilt of the dice, not a promise.
Hawaii goes the other way. El Niño typically brings the islands a drier wet season, because the Kona lows that deliver heavy winter rain become less frequent. At the same time, El Niño makes the central Pacific friendlier to hurricanes, which is exactly what Hawaii saw in September (more below).
UK and Europe: a wet, stormy autumn, then a colder late-winter risk
Europe sits far from the Pacific, so the link is weaker and less consistent from one event to the next. The Met Office expects the main effect to be wetter, stormier conditions for the UK and north-west Europe in autumn and early winter, followed by a somewhat higher chance of colder spells in the second half of winter, from January to March. It stresses that El Niño is only one influence among many. Its long-range forecasting chief, Professor Adam Scaife, put the scale of this event plainly: “I have never seen an El Niño signal this intense in our forecasts.”
The autumn storm season has already started. A rapidly deepening Atlantic low is forecast to bring gusts of 100–130 km/h to Ireland, Northern Ireland, Scotland and western England on the night of 29–30 September. No single storm can be blamed on El Niño, but it is the kind of weather the outlook describes. You can follow it live on our wind map and the Europe rain radar.
Peru and Ecuador: a “coastal El Niño” alert
Peru’s official El Niño committee, ENFEN, keeps a coastal El Niño alert in force, with the most likely magnitude between strong and extraordinary. Its bulletins give the highest odds of an extraordinary event between September 2026 and January 2027. It expects rain on the northern coast from November, above-normal rainfall on the northern and central coast through the southern summer, and heat near 40°C in the north. The event is expected to last into the southern autumn of 2027, fading after the first months of the year. This is the region where the 1982–83 and 1997–98 El Niños did their worst damage.
South America: floods in the south, drought in the Amazon
El Niño splits the continent. Southern Brazil, Uruguay and north-eastern Argentina tend to turn wetter: forecasters in Rio Grande do Sul expect a spring with rainfall well above average, with November and December of greatest concern. The Amazon and north-eastern Brazil tend to dry out, and Brazilian technical notes warn of a drought that could match or exceed 2015, with low rivers and high fire risk.
Southern Africa: drought risk for the rainy season
The Southern African Development Community’s seasonal outlook favours below-normal rainfall from October 2026 into early 2027 across much of the region, including Angola, Namibia, Botswana, Zimbabwe, Zambia, Mozambique, most of South Africa, Eswatini and Lesotho. The strongest historical links between El Niño and rainfall deficits are in Zimbabwe, south-central Mozambique, southern Malawi and southern Zambia. Above-normal rain is favoured in eastern DR Congo, most of Tanzania and northern Malawi.
East Africa: wetter short rains
The Greater Horn of Africa is the opposite case. With El Niño and a positive Indian Ocean Dipole working together, the regional climate centre ICPAC forecasts a wetter-than-normal October–December season, with a 90% chance of enhanced rainfall over southern Ethiopia, central and southern Somalia and north-eastern Kenya. ICPAC’s closest analogue years are 1997 and 2023, both of which brought serious flooding to the region.
India: a weak monsoon
El Niño tends to weaken the Indian summer monsoon, and 2026 has followed the script. In May, the India Meteorological Department cut its forecast to 90% of the long-period average, with a 60% chance of a deficient season. By the end of August the June–August rains were 13.8% below normal, with 47% of the country rain-deficient.
Indonesia and South-East Asia: fires and haze
El Niño pushes rainfall away from Indonesia, and the dry season there has been severe. More than 212,000 fire hotspots were detected in peat areas in the first eight months of 2026, according to the Indonesian group Pantau Gambut, more than double the number recorded during the strong El Niño of 2015. Over 12.5 million people in seven provinces have been exposed to smoke, and haze has drifted into Malaysia and Singapore. Peat fires can smoulder underground for months, so relief usually has to wait for the monsoon rains. Our air quality map shows the smoke in real time.
Australia: the wet El Niño, and a hot spring
Australia’s Bureau of Meteorology declared El Niño in June, and El Niño normally means drought there. Yet 2026 has so far been the wettest El Niño year on record nationally, with more than 400 mm by the end of August. The Bureau credits waters 1–2°C above average in the central Indian Ocean, which have fed moisture across the continent. The spring outlook splits the country: wetter than usual in Western Australia and the Northern Territory, drier on the eastern seaboard, with an 80% chance of below-median rain in parts of Victoria and Tasmania. National spring temperatures are forecast around 2°C above the 1961–1990 average, which would challenge 2024’s record.
The Hurricane Seasons Have Flipped
El Niño strengthens the upper-level winds over the tropical Atlantic, and that wind shear tears developing hurricanes apart. The 2026 Atlantic season is a textbook example: it reached 21 September without a single hurricane for the first time since 1914, producing only short-lived tropical storms in what is normally the peak of the season.
The Pacific has had the opposite season. On 22 September, Hurricane Polo went from Category 1 to Category 5 in less than 24 hours off Mexico, becoming one of the most intense eastern Pacific hurricanes on record. After regaining Category 5 strength at sea, it weakened before coming ashore in Baja California Sur early on 29 September as a Category 2 hurricane. Further west, Hurricane Nolo reached Category 4 and passed south of Hawaii’s Big Island, bringing heavy rain and dangerous surf. Warmer water and weaker wind shear in the central and eastern Pacific are classic El Niño conditions.
2027: Likely the Hottest Year on Record
El Niño releases heat stored in the Pacific into the atmosphere, but global temperatures take a few months to respond. That is why the record-warm years 2016 and 2024 each came after a big El Niño had peaked, not at its peak.
The same pattern points to 2027. The Met Office’s Dr Nick Dunstone says this large El Niño means that “2027 is very likely to replace 2024 as the warmest year on record”. The warm-up has already begun: August 2026 tied the hottest month ever recorded, at 1.65°C above pre-industrial levels. For the full picture of this year’s race, see Is 2026 going to be the hottest year ever recorded?
How Long Will It Last, and Is La Niña Next?
This El Niño is not going anywhere soon. IRI’s forecast gives a 100% chance of El Niño conditions through February 2027, still 90% in April–June 2027, and 61% in May–July 2027. Peru’s ENFEN expects its coastal El Niño to last into the southern autumn of 2027.
After that, history suggests a swing the other way. The 1997–98 event was followed by a long La Niña, and 2015–16 and 2023–24 were each followed by La Niña conditions. NOAA’s GFDL model already has most of its ensemble members turning the equatorial Pacific cooler than average by next summer. It is far too early to call, but a La Niña in late 2027 would not be a surprise.
Is Climate Change Making El Niño Stronger?
El Niño is a natural cycle that long predates human influence, and scientists are still debating whether warming is making the events themselves stronger or more frequent. What is not in doubt is the baseline: every El Niño now arrives on top of a warmer planet. Warmer air holds more moisture, so heavy rain can be heavier, and the heat released by El Niño lands on temperatures that are already near record levels. That is also why NOAA switched to a relative index: to separate the El Niño signal from the background warming. Our El Niño and La Niña explainer covers the cycle itself in more depth.
How to Follow This El Niño on RainyMap
- Rain map: watch Pacific storm systems line up toward California and the Gulf Coast as the winter pattern sets in.
- Wind map: follow autumn storms into Ireland, the UK and north-west Europe, and tropical cyclones in the Pacific.
- Temperature map: see the warm and mild zones, from the northern US to eastern Australia.
- Air quality map: track the haze from Indonesia’s peat fires across South-East Asia.
- Lightning map: El Niño shifts where tropical thunderstorms form, and the lightning shows it.
Frequently Asked Questions
What is a super El Niño?
“Super El Niño” is an informal name for an exceptionally strong El Niño, when the central Pacific stays around 2°C or more above normal for a season. The best-known examples are 1982–83, 1997–98 and 2015–16. NOAA’s official terms are “very strong” for a Relative Oceanic Niño Index of +2.0°C or more, and “historic” for an event above +2.5°C, which would beat every El Niño since 1950.
Is the 2026 El Niño the strongest on record?
On weekly measurements, yes: the Niño 3.4 region reached +3.1°C in the week of 23 September 2026, the highest weekly value in NOAA’s record, and the Niño 1+2 and Niño 3 regions also set records. On NOAA’s official three-month index it has not yet passed the record of +2.40°C set in 1982–83, but NOAA gives a 75% chance that October–December 2026 will exceed +2.5°C.
When will the 2026 El Niño peak?
Most models put the peak between October 2026 and January 2027, the usual peak season for El Niño. Its effects on North American weather are most widespread from December to March, and the boost to global temperatures typically peaks a few months after El Niño itself, in 2027.
What does El Niño mean for winter in the United States?
It tilts the odds toward a wetter, stormier winter across the southern states, from California and the Southwest to the Gulf Coast and Florida, and toward a milder, often drier winter across the northern states, from the Pacific Northwest through the northern Plains and Midwest. The effects are strongest from December to March.
Will California have a wet winter in 2026–27?
The odds favour it, especially in Southern California, but it is not guaranteed. Strong El Niños in 1982–83 and 1997–98 brought very wet winters, while in 2015–16 coastal Southern California received only 60–68% of normal rainfall as storms tracked further north. The 2026 event is shaped more like 1997–98, with its warmth concentrated in the eastern Pacific.
What does El Niño mean for the UK and Europe?
The Met Office expects El Niño to raise the chances of a wetter, stormier autumn and early winter for the UK and north-west Europe, and to slightly raise the chance of colder spells between January and March. The link is weaker than in the Pacific region, and El Niño is only one of many influences on European weather.
Will 2027 be the hottest year on record?
It is very likely. Global temperatures peak a few months after El Niño does, which is why 2016 and 2024 set records after the big El Niños of 2015 and 2023. The Met Office says 2027 is very likely to replace 2024 as the warmest year on record.
How long will El Niño last, and will La Niña follow?
The IRI forecast gives a 100% chance of El Niño through February 2027, falling to 61% by May–July 2027. Big El Niños are often followed by La Niña, as after 1997–98, 2015–16 and 2023–24, and NOAA’s GFDL model shows the Pacific turning cooler than average by summer 2027, so a La Niña in late 2027 is possible.
Does El Niño affect hurricanes?
Yes. El Niño increases wind shear over the tropical Atlantic, which suppresses hurricanes, and makes the central and eastern Pacific more favourable for them. In 2026 the Atlantic reached 21 September without a hurricane for the first time since 1914, while the Pacific produced Category 5 Hurricane Polo and Category 4 Hurricane Nolo.
Where does this data come from?
The ocean temperature figures come from NOAA’s Climate Prediction Center, which publishes weekly Niño index values from satellite and ocean measurements (OISST) and the three-month Oceanic Niño Index and Relative Oceanic Niño Index. Forecast probabilities come from NOAA and from the International Research Institute for Climate and Society (IRI) at Columbia University. Regional outlooks come from national and regional weather services.
Sources
- NOAA Climate Prediction Center: ENSO Diagnostic Discussion (10 September 2026)
- NOAA CPC: weekly Niño region indices (OISST v2.1), to the week of 23 September 2026
- NOAA CPC: Oceanic Niño Index (ONI) and Relative Oceanic Niño Index (RONI)
- NOAA CPC: official ENSO strength classification (RONI)
- IRI, Columbia University: ENSO forecast (21 September 2026)
- NOAA GFDL: September 2026 El Niño predictions
- National Weather Service: El Niño and La Niña information
- The Weather Channel: What a historic super El Niño means for your fall and winter (22 September 2026)
- Scripps Institution of Oceanography: Why was the 2015–16 El Niño so dry?
- Journal of Climate: Predictability and prediction of Southern California rains during strong El Niño events
- ABC News: El Niño declared by the Bureau of Meteorology (16 June 2026)
- Met Office: An “unprecedented” El Niño and its implications for the weather forecast (21 August 2026)
- Severe Weather Europe: Atlantic bomb cyclone targets the UK and Ireland (29 September 2026)
- Infobae: ENFEN expects coastal El Niño to last until autumn 2027 (29 September 2026)
- Extra Classe: Rio Grande do Sul spring forecast well above average rainfall (September 2026)
- Agência Cenarium: El Niño 2026 may trigger an Amazon drought worse than 2015
- SADC seasonal outlook favours drier conditions across much of southern Africa (via AllAfrica, 28 August 2026)
- ICPAC: wetter-than-normal October–December 2026 season for the Greater Horn of Africa
- Down To Earth: IMD revises monsoon forecast to 90% of LPA (29 May 2026)
- Business Standard: IMD predicts below-normal September rains; 47% of country rain-deficient (31 August 2026)
- France 24: The wildfires choking Indonesia, sparking regional haze (28 September 2026)
- ABC News: Why Australia is seeing a soaking during a record El Niño (22 August 2026)
- WCAX: First Atlantic hurricane season without a hurricane by 21 September in 112 years
- The Weather Channel: Category 5 Hurricane Polo among most intense on record (22 September 2026)
- CNBC: Hurricane Polo lashes Mexico’s Baja California Sur (29 September 2026)
- NPR: Hurricane Nolo threatens Hawaii (25 September 2026)
- The Weather Channel: How El Niño could reshape Hawaii’s weather (August 2026)
- NASA Earth Observatory: El Niño Is Underway (18 June 2026)