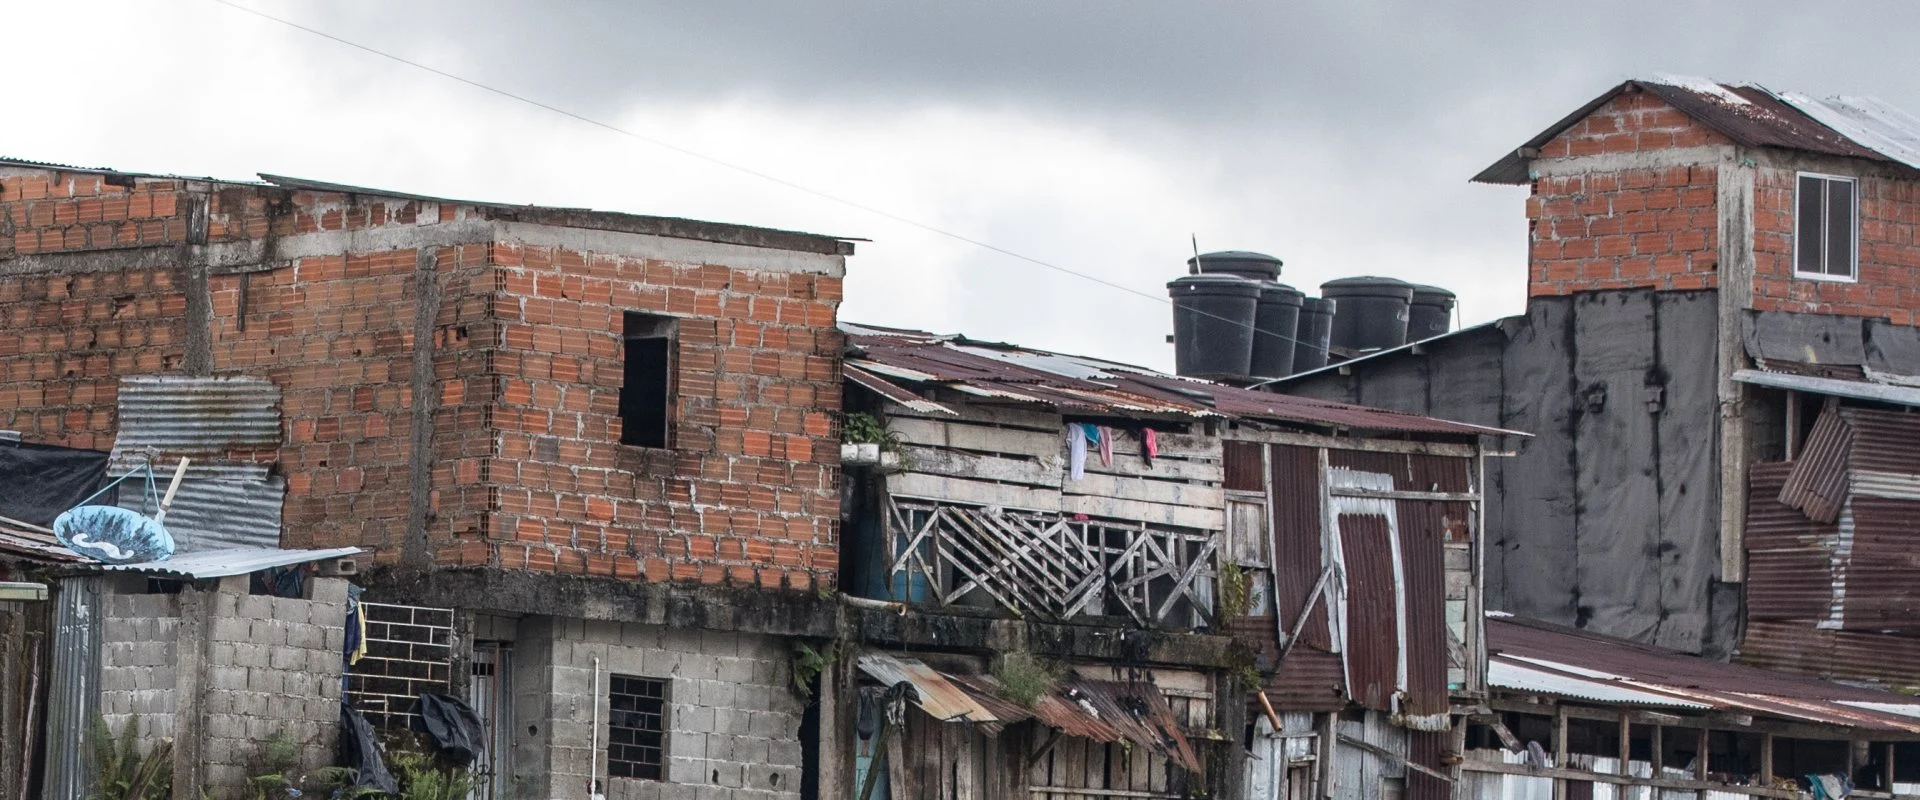
The rainiest city in the world is Quibdó, Colombia, with about 8,157 mm (321 inches) of rain a year and rain on 287 days, according to its official 1991-2020 climate normals. The wettest place on Earth is Mawsynram, a village in north-east India that averages about 11,870 mm a year. Among big cities, the wettest are on West Africa’s Atlantic coast, led by Monrovia, Freetown and Conakry.
We compared the official climate averages for 119 cities on every continent, from Ketchikan to Kuching, and ranked them by how much rain falls in a year and how often it rains. Quibdó tops both lists by a wide margin.
Below you will find the top 20, the rainiest big cities, the cities with the most rainy days, the wettest place on Earth, and where the US and Europe fit in.
Rainiest Cities in the World: Key Facts
- Rainiest city: Quibdó, Colombia, 8,157 mm a year and 287 rainy days.
- Runner-up: Buenaventura, also on Colombia’s Pacific side, 6,898 mm.
- Wettest month anywhere in our list: July in Sittwe, Myanmar, about 1,334 mm, twice what London gets in a year.
- Rainiest big city: Monrovia, Liberia, 4,561 mm.
- Rainiest US city: Ketchikan, Alaska, 3,798 mm.
- Rainiest European city: Bergen, Norway, 2,496 mm, only 34th in the world.
- Driest city we checked: Lima, Peru, about 6 mm a year.
The 20 Rainiest Cities in the World
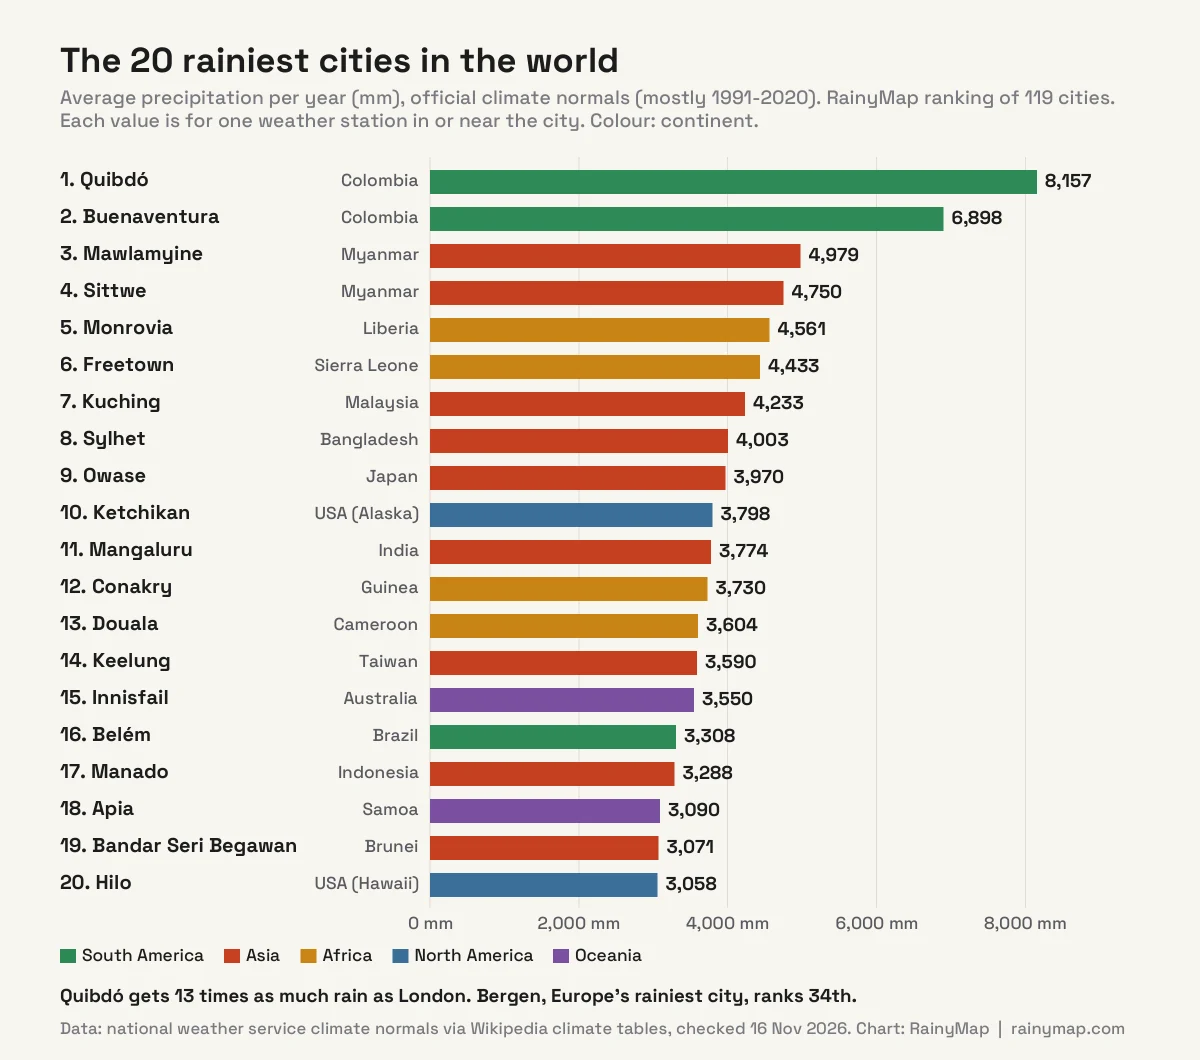
This ranking uses each city’s official climate normals: 30-year averages published by national weather services, mostly for 1991-2020. Where a city has several stations, we used the main one listed for the city.
| # | City | Country | Rain per year | Wettest month | Period |
|---|---|---|---|---|---|
| 1 | Quibdó | Colombia | 8,157 mm | August (867 mm) | 1991–2020 |
| 2 | Buenaventura | Colombia | 6,898 mm | October (807 mm) | 1981–2010 |
| 3 | Mawlamyine | Myanmar | 4,979 mm | July (1,240 mm) | 1991–2020 |
| 4 | Sittwe | Myanmar | 4,750 mm | July (1,334 mm) | 1991–2020 |
| 5 | Monrovia | Liberia | 4,561 mm | September (914 mm) | 1991–2020 (station 60 km away) |
| 6 | Freetown | Sierra Leone | 4,433 mm | July (1,190 mm) | 1961–1990 |
| 7 | Kuching | Malaysia | 4,233 mm | January (672 mm) | 1991–2020 |
| 8 | Sylhet | Bangladesh | 4,003 mm | June (795 mm) | 1991–2020 |
| 9 | Owase | Japan | 3,970 mm | September (746 mm) | 1991–2020 |
| 10 | Ketchikan | USA (Alaska) | 3,798 mm | October (467 mm) | 1991–2020 |
| 11 | Mangaluru | India | 3,774 mm | July (1,160 mm) | 1961–1990 |
| 12 | Conakry | Guinea | 3,730 mm | August (1,142 mm) | 1991–2020 |
| 13 | Douala | Cameroon | 3,604 mm | August (691 mm) | 1991–2020 |
| 14 | Keelung | Taiwan | 3,590 mm | November (397 mm) | 1991–2020 |
| 15 | Innisfail | Australia | 3,550 mm | March (663 mm) | 1881–2020 |
| 16 | Belém | Brazil | 3,308 mm | March (506 mm) | 1991–2020 |
| 17 | Manado | Indonesia | 3,288 mm | January (427 mm) | 1961–1990 |
| 18 | Apia | Samoa | 3,090 mm | January (483 mm) | 1991–2020 |
| 19 | Bandar Seri Begawan | Brunei | 3,071 mm | December (359 mm) | 1991–2020 |
| 20 | Hilo | USA (Hawaii) | 3,058 mm | November (366 mm) | 1991–2020 |
Every city in the top 20 lies in or near the tropics, apart from Ketchikan in Alaska and Owase in Japan. Thirteen of the 20 are in Asia or Africa, and many get the bulk of their rain from a summer monsoon. For a sense of scale: in July alone, Sittwe and Mawlamyine in Myanmar each get more than twice London’s yearly rainfall.
Why Is Quibdó the Rainiest City in the World?
Quibdó is the capital of Colombia’s Chocó department, a strip of rainforest between the Pacific Ocean and the Andes. Warm, humid air from the Pacific is carried inland by a low-level westerly wind known as the Chocó jet and then forced up the slopes of the Western Cordillera of the Andes. In a study in Geophysical Research Letters, Colombian researchers Germán Poveda and Óscar Mesa described the Chocó region as receiving 8,000 to 13,000 mm of rain a year, from that moisture convergence, the mountains and large clusters of night-time thunderstorms. The World Meteorological Organization lists an older Quibdó average of 8,990 mm as South America’s record; we use the newer 1991-2020 figure from Colombia’s weather service, IDEAM.
The rain never really stops. Quibdó’s driest month, February, still averages about 487 mm, almost as much as London gets in a whole year. The wettest, August, brings about 867 mm. With rain on 287 days a year, a dry day is the exception.
Where Are the Rainiest Cities in the World?
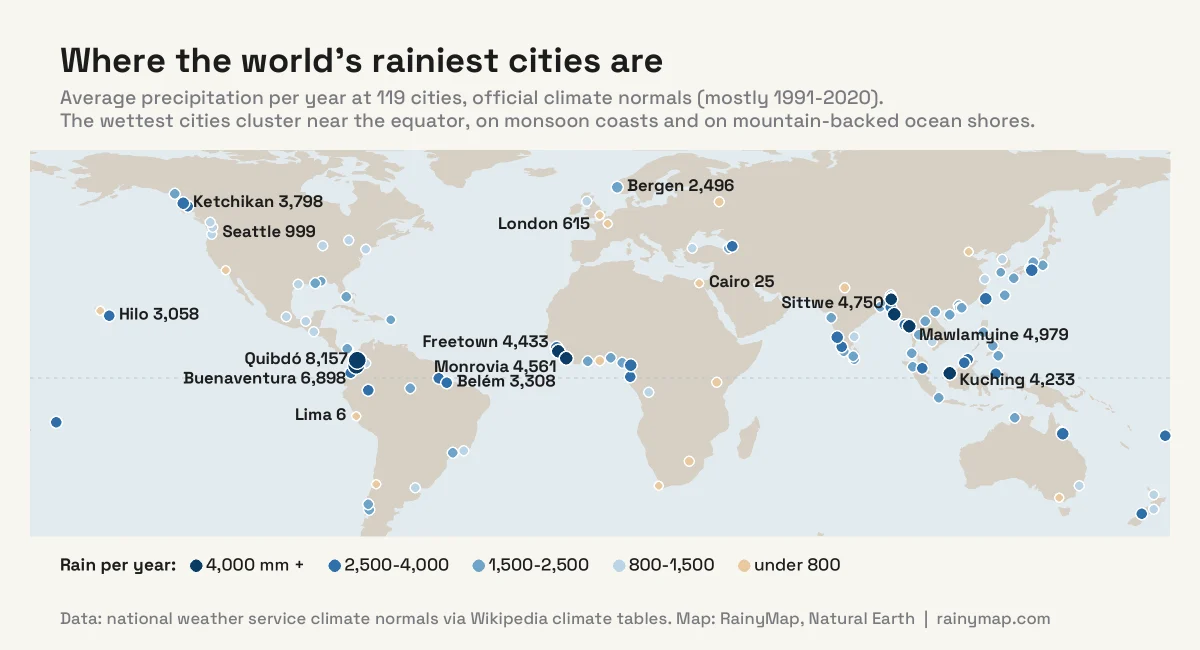
Three patterns explain almost every city near the top:
- The equatorial rain belt. Near the equator, strong sunshine drives warm, humid air upwards all year. The trade winds of both hemispheres meet in a band called the Intertropical Convergence Zone (ITCZ), where rising air builds tall thunderclouds almost daily. Quibdó, Kuching, Belém and Douala all sit close to it.
- Monsoon coasts. In summer, moist winds blow in from the Indian Ocean and the Bay of Bengal. Where they hit land, especially high ground, they drop extraordinary amounts of rain. That is why Sittwe, Mawlamyine, Sylhet, Mangaluru and the hills of north-east India are so wet, and why their rain comes in a few months.
- Mountains behind an ocean. Air forced up a slope cools and drops its moisture. Ketchikan, Hilo, Bergen, Owase and Hokitika all have mountains rising straight behind them, facing wet ocean winds.
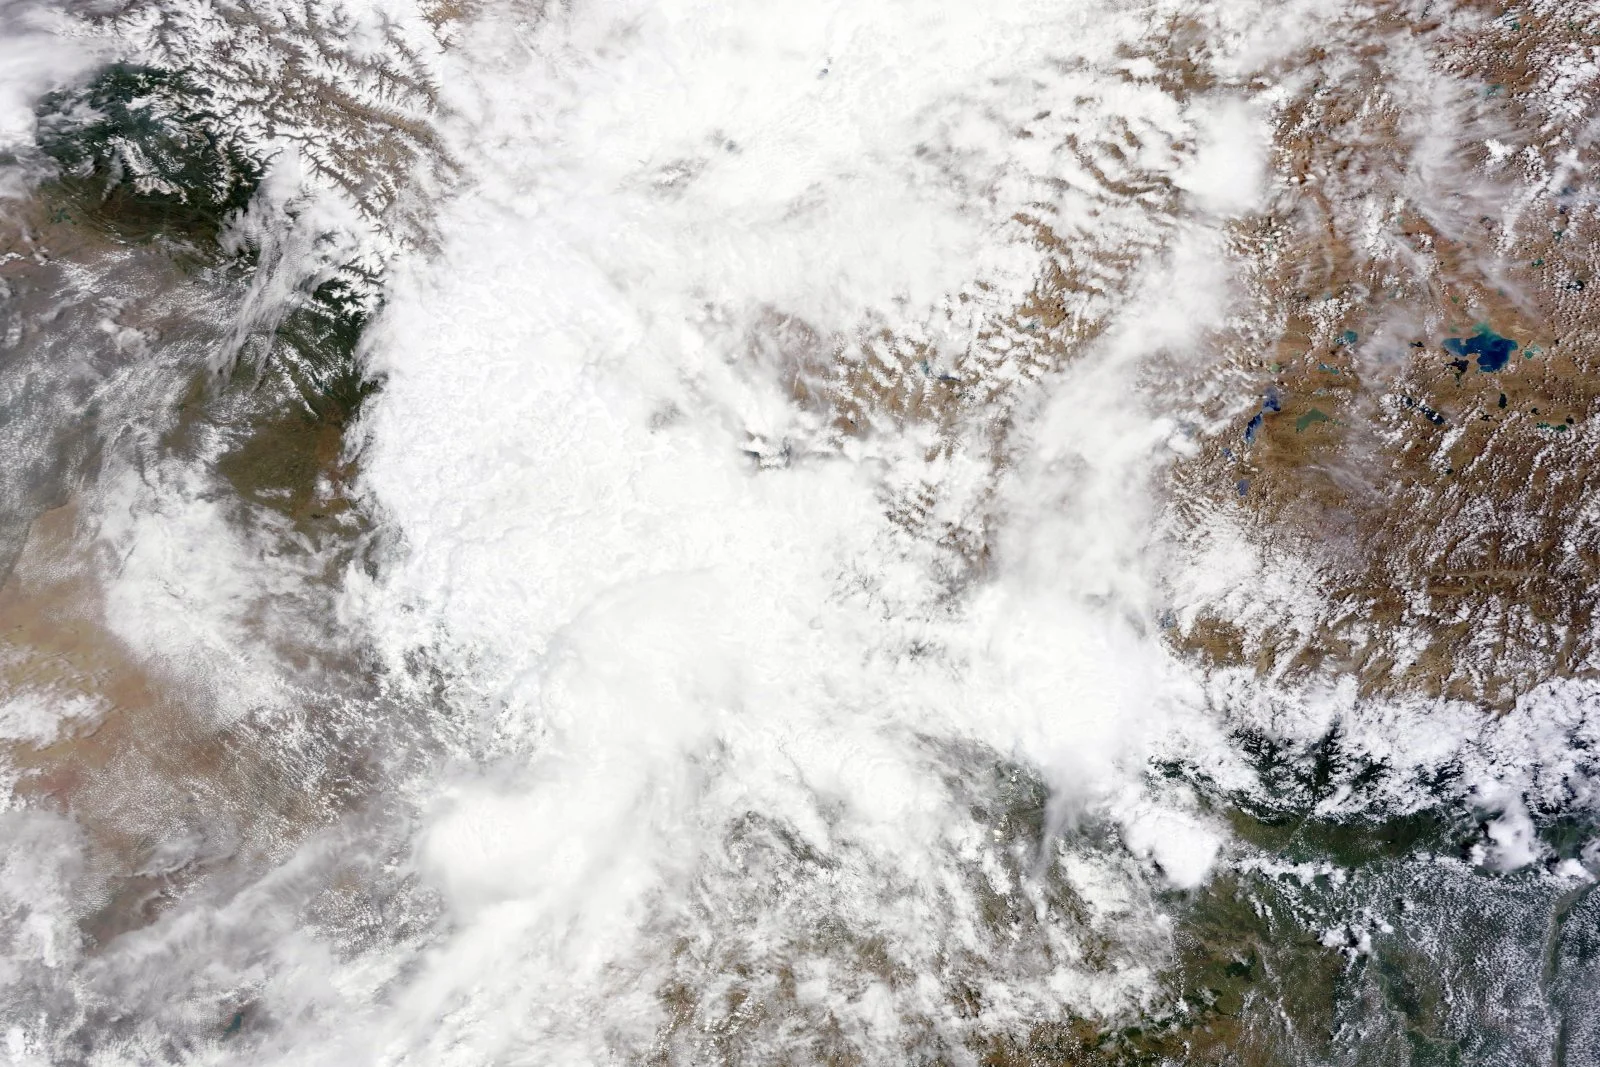
The same forces work in reverse on the other side of the mountains, or where cold ocean currents keep the air stable. Lima, on Peru’s coast, gets about 6 mm a year, and Cairo about 25 mm.
What Are the Rainiest Big Cities in the World?
Most of the very wettest places are small or medium-sized cities. Among cities with a metro population of 1 million or more, the rainiest are on the Atlantic coast of West Africa, where the summer monsoon pushes moist air from the Gulf of Guinea against the coast.
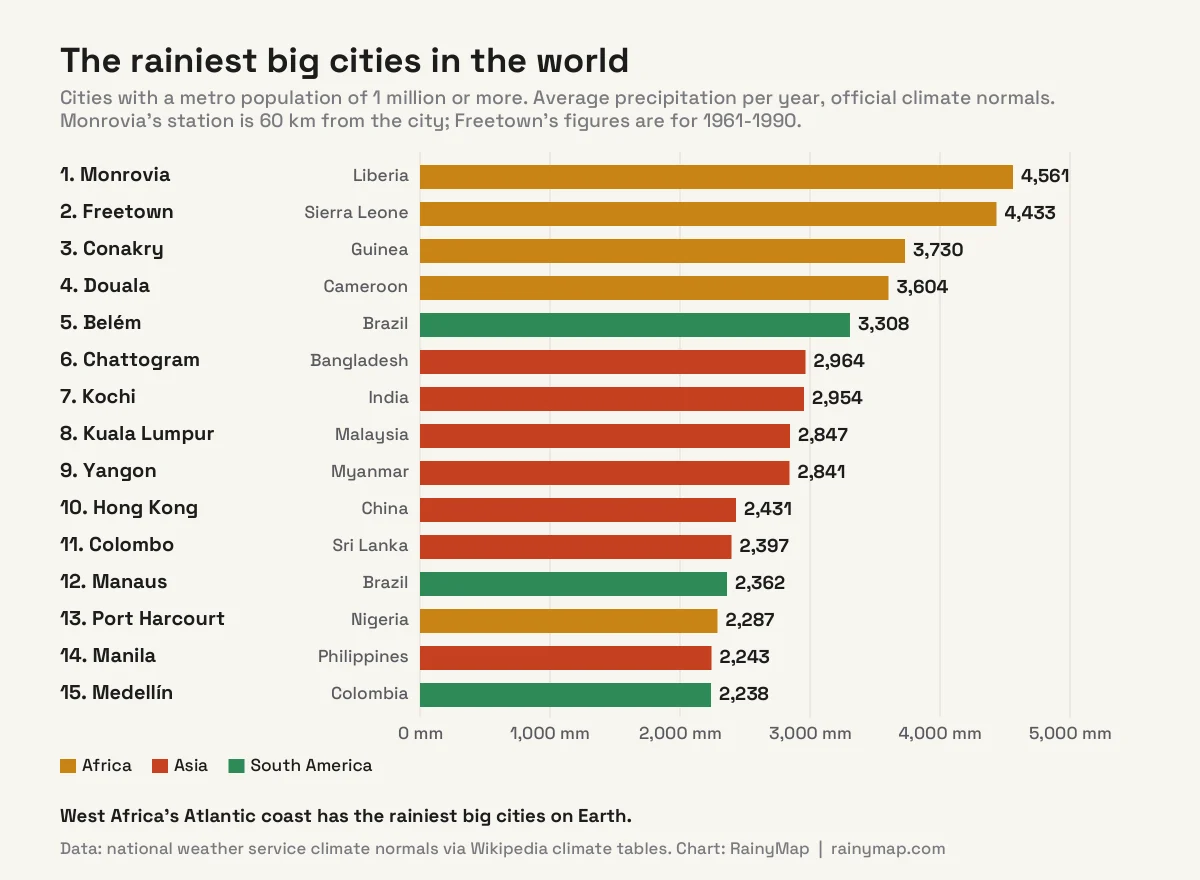
Two caveats: Monrovia’s figures come from Roberts International Airport, about 60 km from the city, and Freetown’s are for 1961-1990. Of the big cities with current normals measured in the city itself, Conakry, Guinea leads at 3,730 mm. In Asia, Chattogram, Kochi, Kuala Lumpur and Yangon all get about 2,840-2,960 mm, a little less than Hilo in Hawaii. Hong Kong (2,431 mm) and Mumbai (2,213 mm) also rank in the world’s top 50.
Which Cities Have the Most Rainy Days?
A city can be very wet but sunny between storms, so we also ranked cities by the number of days with at least 1 mm of rain. Quibdó wins again, with rain on about four days in every five.
| # | City | Rainy days a year | Rain per year |
|---|---|---|---|
| 1 | Quibdó, Colombia | 287 | 8,157 mm |
| 2 | Belém, Brazil | 223 | 3,308 mm |
| 3 | Kuching, Malaysia | 211 | 4,233 mm |
| 4 | Bandar Seri Begawan, Brunei | 211 | 3,071 mm |
| 5 | Bergen, Norway | 201 | 2,496 mm |
| 6 | Suva, Fiji | 188 | 2,992 mm |
| 7 | Glasgow, UK | 181 | 1,370 mm |
| 8 | Apia, Samoa | 173 | 3,090 mm |
| 9 | Medellín, Colombia | 173 | 2,238 mm |
| 10 | Hokitika, New Zealand | 172 | 2,921 mm |
Bergen and Glasgow make this list even though their yearly totals are modest by tropical standards: they get frequent, steady rain from Atlantic weather systems. Mumbai is the opposite extreme. It gets 2,213 mm a year, but 95% of it falls in the four monsoon months, from June to September.
Some countries count rainy days differently, so we left them out of the table. US stations, for example, count days with at least 0.01 inch (0.25 mm). On that looser threshold, Hilo records about 273 rainy days a year and Ketchikan about 233.
What Is the Wettest Place on Earth?
Not a city, but two villages a few kilometres apart in the Khasi Hills of Meghalaya, north-east India. In summer, the monsoon drives moist air from the Bay of Bengal north across the flat plains of Bangladesh, straight into these hills, which force it up and wring out the rain. Researchers have traced it to repeated bursts of monsoon rain interacting with the steep terrain, with deep storm clouds forming most often in the valleys near the two villages.
- Mawsynram averages about 11,872 mm a year, the highest average for any place in Asia in the World Meteorological Organization’s records. Guinness World Records lists it as the wettest place on Earth by average annual rainfall.
- Cherrapunji (Sohra), nearby, averages 11,176 mm a year in the India Meteorological Department’s official 1991-2020 normals, with 153 days of at least 2.5 mm.
- Cherrapunji also holds the world record for the most rain in 12 months: 26,470 mm between August 1860 and July 1861 (WMO). July 1861 alone brought about 9,300 mm, according to Guinness World Records.
Two other places rival them. Mount Waiʻaleʻale on Kauai, Hawaii, is listed by the WMO at 11,640 mm a year, though the newer Rainfall Atlas of Hawaiʻi puts Hawaii’s wettest spot at Big Bog on Maui, about 10,271 mm. And Lloró in Colombia’s Chocó has been claimed to get more than 12,000 mm, based on measurements from the 1950s; its official 1981-2010 average from IDEAM is about 7,807 mm.

The world’s other rain records are just as extreme. The most rain in 24 hours is 1,825 mm, at Foc-Foc on the island of Réunion during a tropical cyclone on 7-8 January 1966. The most in 48 hours is 2,493 mm, at Cherrapunji on 15-16 June 1995 (WMO).
What Is the Rainiest City in the United States?
Ketchikan, Alaska, with about 3,798 mm (150 inches) a year, followed by Hilo on Hawaii’s Big Island at 3,058 mm. Both face wet ocean winds with mountains right behind them.
| # | US city | Rain per year | World rank (of 119) |
|---|---|---|---|
| 1 | Ketchikan, Alaska | 3,798 mm (149.5 in) | 10 |
| 2 | Hilo, Hawaii | 3,058 mm (120.4 in) | 20 |
| 3 | Juneau, Alaska | 2,276 mm (89.6 in) | 43 |
| 4 | Miami | 1,712 mm (67.4 in) | 66 |
| 5 | Mobile | 1,704 mm (67.1 in) | 67 |
| 6 | New Orleans | 1,609 mm (63.3 in) | 76 |
| 7 | Houston | 1,317 mm (51.9 in) | 90 |
| 8 | New York | 1,258 mm (49.5 in) | 91 |
| 9 | Chicago | 1,038 mm (40.9 in) | 98 |
| 10 | Seattle | 999 mm (39.3 in) | 99 |
| 11 | Portland | 938 mm (36.9 in) | 100 |
| 12 | Honolulu, Hawaii | 417 mm (16.4 in) | 115 |
| 13 | Los Angeles | 362 mm (14.3 in) | 116 |
In the lower 48 states, the Gulf Coast and Florida are the wettest major cities: Miami, Mobile and New Orleans all get more than 1,600 mm a year, much of it in summer thunderstorms. Seattle, famous for its rain, gets 999 mm, less than New York, Chicago or Houston. It simply rains more often and more gently there: about 156 days a year with measurable precipitation. Our ranking of the rainiest cities in the US compares 76 cities using NOAA data.
The Rainiest City on Each Continent
| Continent | Rainiest city | Rain per year | Driest city we checked | Rain per year |
|---|---|---|---|---|
| South America | Quibdó, Colombia | 8,157 mm | Lima, Peru | 6 mm |
| Asia | Mawlamyine, Myanmar | 4,979 mm | Beijing, China | 528 mm |
| Africa | Monrovia, Liberia | 4,561 mm | Cairo, Egypt | 25 mm |
| North America | Ketchikan, USA (Alaska) | 3,798 mm | Los Angeles, USA | 362 mm |
| Oceania | Innisfail, Australia | 3,550 mm | Melbourne, Australia | 516 mm |
| Europe | Bergen, Norway | 2,496 mm | London, UK | 615 mm |
Europe’s rainiest city, Bergen, would not make the global top 30. Our separate ranking of the rainiest cities in Europe compares 85 European cities by rainfall and rainy days.
How We Built This Ranking
We collected the climate tables for 119 cities: the wettest cities we could find on every continent, plus the world’s best-known big cities for comparison. Each table lists 30-year averages from a national weather service, such as Colombia’s IDEAM, the US National Oceanic and Atmospheric Administration (NOAA), the India Meteorological Department or Japan’s JMA, as cited on the city’s Wikipedia page. We checked every table on 16 November 2026.
- Official data only. We left out tables with no stated period, and those based on modelled data rather than a weather station: Bogor and Padang in Indonesia, for example, which are often listed among the rainiest cities.
- One station per city. Some are at airports outside the centre, which we note where it matters.
- Same period where possible. Most use 1991-2020 normals. Freetown, Mangaluru and Manado use 1961-1990, and a few others use 1981-2010.
- Towns versus cities. Villages such as Mawsynram and Cherrapunji are covered in the “wettest place” section rather than the city ranking.
How to See Where It Is Raining Right Now
Climate averages tell you what to expect over a year. To see what is falling today:
- Open our map of where it is raining right now for a live view of every rain area on Earth.
- Zoom in on any city with the real-time rain map, or open a city page such as Bangkok rain radar or Mumbai rain radar.
- Check a forecast’s percentage with our guide to what a chance of rain really means.
- Planning a trip to a monsoon country? Our best time to visit guides show the driest months, for example in Bangkok and the Philippines.
Frequently Asked Questions
What is the rainiest city in the world?
Quibdó, Colombia. Its official 1991-2020 normals show about 8,157 mm of rain a year and 287 days with at least 1 mm, both the highest of the 119 cities we compared. That is about 13 times as much rain as London.
What is the wettest place on Earth?
Mawsynram, a village in the Khasi Hills of north-east India, which averages about 11,872 mm (467 inches) of rain a year according to the World Meteorological Organization and Guinness World Records. Neighbouring Cherrapunji holds the record for the most rain in 12 months: 26,470 mm in 1860-1861.
What is the rainiest big city in the world?
Among cities of 1 million people or more, the wettest are on West Africa’s Atlantic coast: Monrovia, Liberia (4,561 mm, measured at the airport 60 km from the city), Freetown, Sierra Leone (4,433 mm, 1961-1990), and Conakry, Guinea (3,730 mm, 1991-2020). Outside Africa, Belém in Brazil leads with 3,308 mm.
Which city has the most rainy days in the world?
Quibdó, with about 287 days a year with at least 1 mm of rain: it rains on roughly four days out of five. Belém (223), Kuching (211) and Bandar Seri Begawan (211) follow. Bergen, Europe’s rainiest city, has 201.
What is the rainiest city in the United States?
Ketchikan, Alaska, with about 3,798 mm (150 inches) a year, followed by Hilo, Hawaii (3,058 mm). In the lower 48 states, the wettest big cities in our ranking are Miami (1,712 mm), Mobile, Alabama (1,704 mm) and New Orleans (1,609 mm).
Is Seattle the rainiest city in the US?
No. Seattle gets about 999 mm (39 inches) a year at Sea-Tac Airport, less than New York (1,258 mm), Houston or Miami. Its reputation comes from frequent light rain and grey skies: Seattle records about 156 days a year with measurable precipitation.
Is Bergen the rainiest city in the world?
No. Bergen, with about 2,496 mm a year, is the rainiest city in Europe but ranks 34th among the 119 cities we compared worldwide. Quibdó gets more than three times as much. Bergen does have one of the highest numbers of rainy days outside the tropics: about 201 a year.
Why is it so rainy near the equator?
The sun heats the tropics strongly all year, so warm, humid air rises, cools and condenses into towering rain clouds. The trade winds from both hemispheres meet in a belt called the Intertropical Convergence Zone, where this rising air is concentrated. Mountains near warm oceans, as in western Colombia or north-east India, squeeze out even more rain.
What is the driest city in the world?
Of the cities we compared, Lima, Peru, is the driest, with about 6 mm a year in its 1991-2020 normals, followed by Cairo at about 25 mm. The driest place with an official long-term record is Arica in northern Chile, which averages just 0.76 mm a year, according to the World Meteorological Organization.
Sources
Data checked on 16 November 2026. City figures are official climate normals (mostly 1991-2020) from national weather services, as published in each city’s Wikipedia climate table; the rankings, charts and analysis are RainyMap’s own.
- Quibdó climate table (IDEAM Promedios Climatológicos 1991-2020), via Wikipedia
- World Meteorological Organization: Records of weather and climate extremes (table, 31 July 2025)
- Guinness World Records: Greatest rainfall in 12 months
- India Meteorological Department 1991-2020 WMO normals for Cherrapunji (station 42515), NOAA archive
- Poveda and Mesa (2000), On the existence of Lloró (the rainiest locality on Earth). Geophysical Research Letters 27(11)
- Murata et al. (2007), Rainfall on the Meghalaya plateau in northeastern India. Natural Hazards 42
- Rainfall Atlas of Hawaiʻi (University of Hawaiʻi)
- NASA Earth Observatory: The Intertropical Convergence Zone
- NOAA National Centers for Environmental Information: US Climate Normals 1991-2020
Featured image: houses under a heavy grey sky beside the Atrato River in Quibdó, Colombia, the rainiest city in the world, October 2022. Photo: Mussi Katz / Wikimedia Commons (CC0).