Rain radar maps look intimidating at first, full of colored blobs, dashed lines, and moving shapes, but once you know what you’re looking at, they become one of the most useful tools for planning your day.
This guide breaks down exactly what you’re seeing on a live rain map and how to use it to make quick, confident decisions about the weather ahead.
Understanding Color Intensity
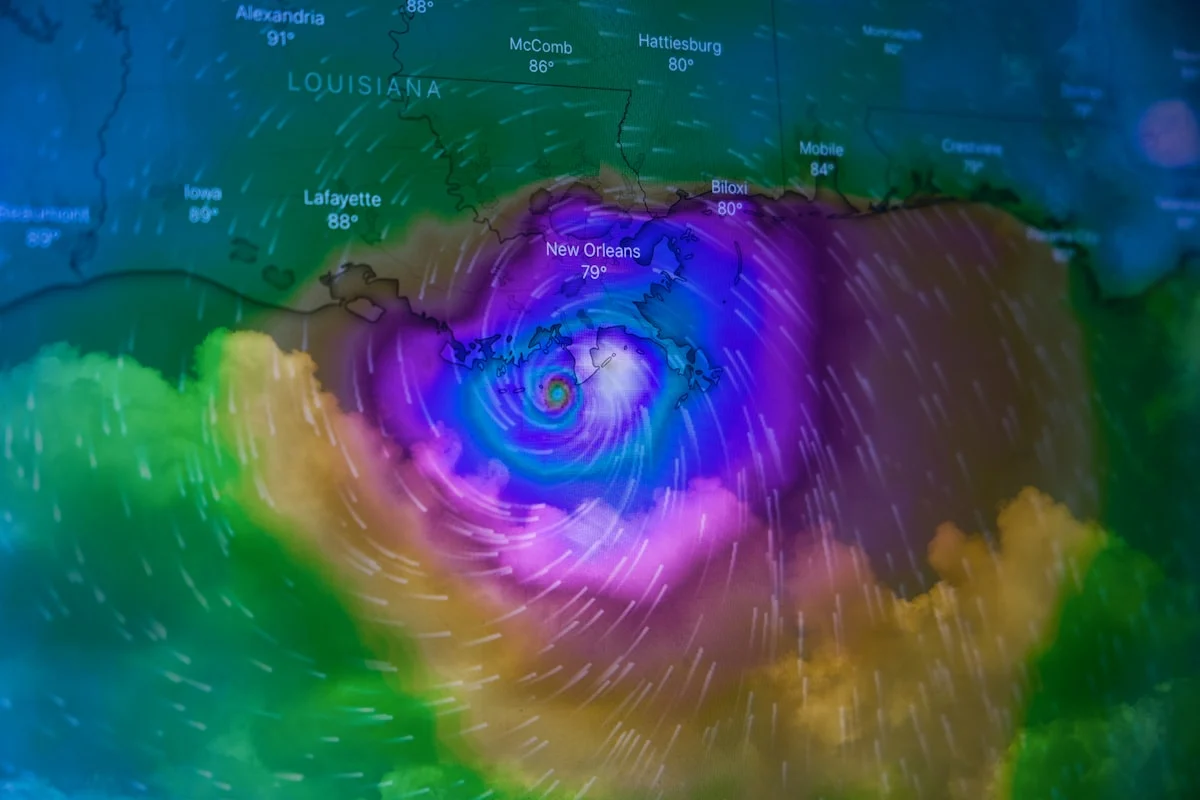
Most rain maps use a color gradient to represent rainfall rate, not just whether it’s raining. Light blues and greens usually mean drizzle or light rain, yellows and oranges indicate moderate rainfall, and reds or purples signal heavy downpours or embedded thunderstorms. The darker and more saturated the color, the more intense the precipitation at that exact location.
Watching Movement, Not Just Position
A single snapshot only tells you where rain is right now. The real value comes from watching the map over several minutes, or using the built-in animation, to see which direction a rain band is moving and how fast. If a storm cell is moving northeast at a steady pace, you can roughly estimate when it will reach your location.
Radar vs. Satellite Data
Some rain maps combine ground-based radar (which detects precipitation directly) with satellite imagery (which infers rainfall from cloud-top temperatures). Radar tends to be more precise over land in radar-covered regions, while satellite data fills in gaps over oceans and remote areas.
Common Reading Mistakes
- Confusing clouds with rain: Not every gray patch on a map is precipitation, some layers show cloud cover rather than rainfall.
- Ignoring the timestamp: Always check when the data was last updated, radar refreshes every few minutes but isn’t instantaneous.
- Overreacting to a single frame: A brief burst of color can be a passing shower rather than a sustained storm, watch the trend.
Pairing Rain Data With Wind and Lightning
Rainfall rarely tells the whole story. Checking our real-time wind map alongside the rain map shows you how fast a system is being pushed along, while the real-time lightning map reveals whether a rain cell has developed into a full thunderstorm.
Estimating When Rain Will Reach You
This is the calculation most people actually want, and it takes about ten seconds. Play the animation and pick a recognisable edge of the rain band. Note roughly how far it travels across the loop, and over how many minutes of real time. That gives you a speed. Then measure how far that edge sits from you and divide.
A band 30 km away moving at 40 km/h arrives in about 45 minutes. A band 10 km away moving at 60 km/h gives you ten. Most mid-latitude systems travel between 30 and 70 km/h, so if you are unsure, assume roughly 50 km/h and you will rarely be far wrong.
Two caveats. Storms grow and decay as they move, so a cell can weaken to nothing before it reaches you or strengthen sharply on arrival. And summer thunderstorms often move far more slowly than frontal rain, sometimes barely at all — which is exactly when rainfall totals become dangerous.
Check the Timestamp Before You Trust It
Every radar frame is a few minutes old by the time you see it. A typical national radar completes a full volume scan every 5 to 10 minutes, then the data has to be processed and distributed. In practice the picture on your screen usually reflects conditions from 5 to 15 minutes ago.
For slow-moving frontal rain that hardly matters. For a fast squall line moving at 80 km/h, ten minutes means the leading edge is already 13 km further on than the map shows. When timing matters, mentally advance the picture.
Zoom Level Changes What You See
Radar is displayed at a fixed underlying resolution, so zooming in past a certain point does not add detail — it just makes the same pixels larger. Zooming in too far can make a light shower look like an alarming block of colour.
A practical habit: check twice. Zoom out to a few hundred kilometres to see the system and where it is going, then zoom in to street level only to confirm whether anything is over you now.
Frequently Asked Questions
How do I read a rain radar map?
Read three things in order: colour for intensity (blue and green are light, yellow and orange moderate, red and purple heavy), movement by playing the animation rather than looking at one frame, and timing by estimating how far the rain is from you and how fast it is travelling.
How far ahead can a rain radar map predict rain?
Reliably about 30 to 90 minutes, by extrapolating the movement of precipitation that already exists. Beyond that, radar cannot help because the rain has not formed yet, and you need a forecast instead.
How old is the data on a rain radar map?
Usually 5 to 15 minutes. Radars complete a scan cycle every 5 to 10 minutes and the data then has to be processed and distributed. For fast-moving storms, assume the leading edge is further along than the map shows.
Why does the radar show rain when it is dry where I am?
Most often the rain is evaporating before reaching the ground, a phenomenon called virga. It can also be that the radar beam is scanning above your local weather at long range, or that a shower is smaller than a single radar pixel.
Does zooming in show more detail?
Only up to a point. Radar has a fixed underlying resolution, so past a certain zoom level you are simply magnifying the same pixels. Zoom out to understand the system, then in only to check your immediate area.
In Conclusion
Once you understand color intensity, movement, and the difference between radar and satellite sources, a rain map stops being a confusing wall of color and becomes a fast, reliable way to answer one simple question: is it going to rain here, and when?